
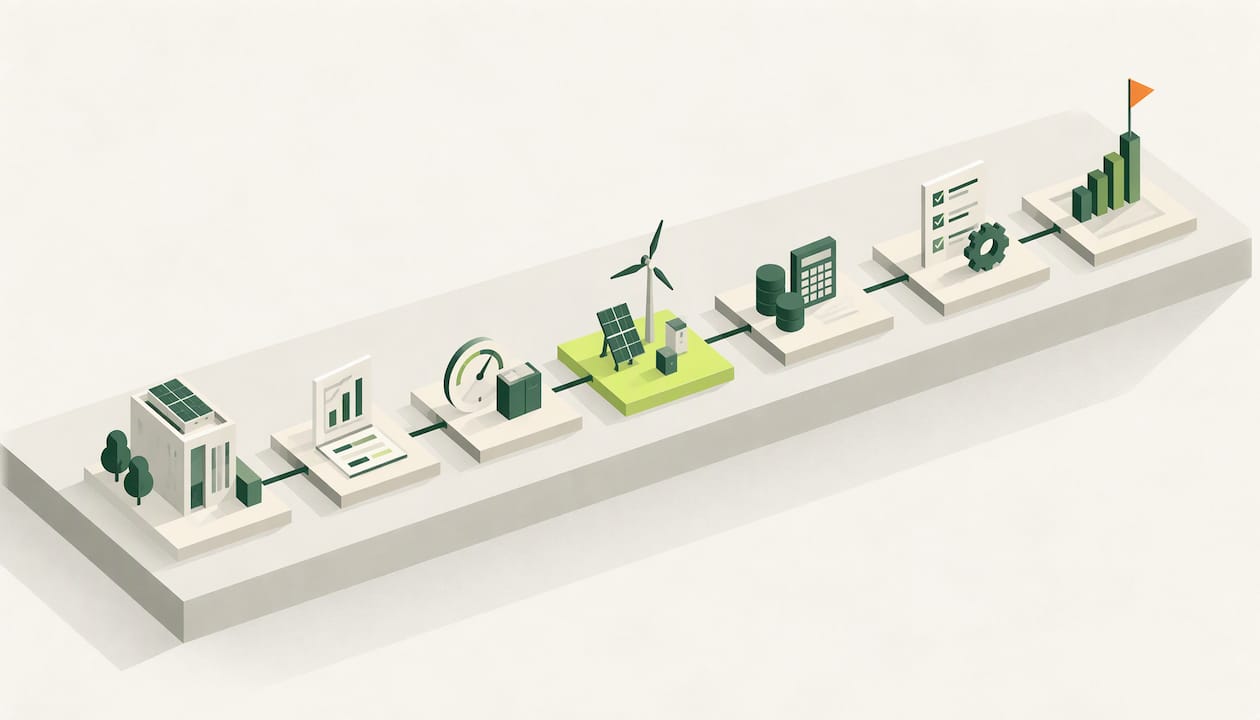
An energy budget is a forecast of what each site will consume and what that consumption will cost, set before the year starts and checked against real bills and meter data every month. The process that works is the same for a single workshop or a fifty-site estate: clean up last year's actuals, strip out one-offs, forecast volume and price separately, then track variances monthly. The hard part is not the arithmetic. It is trusting the bills and meter data you start from, which is where a platform such as EnerlyticsAI earns its place: it validates bills, flags anomalies and shows half-hourly consumption for every site, and its Starter plan is free.
This guide is for finance officers, facility and sustainability managers, and consultants who need a budget they can defend to a board.
TL;DR
- Build the budget on 12 months of verified actual costs, not on bills you have not checked.
- Remove one-off events (shutdowns, refurbishments, extreme weather) and replace them with business-as-usual figures.
- Forecast consumption (kWh) and price (pence per kWh, standing and third-party charges) separately, so you can see which one caused any overspend.
- Track every site monthly against the budget and investigate material variances, not just the total.
- Use the same consumption data for Scope 1, 2 and 3 reporting, so the budget and your net-zero plan do not drift apart.
Table of Contents
- What an energy budget covers
- Step 1: Gather 12 months of actuals
- Step 2: Understand what is on the bill
- Step 3: Normalize the baseline
- Step 4: Forecast consumption first, price second
- Step 5: Price the forecast according to your contract
- Step 6: Track variances monthly, site by site
- Step 7: Connect the budget to carbon reporting
- Common mistakes in energy budgets
- Perspective
- Start your budget on checked data
- FAQ
- Sources
What an energy budget covers
The Energy Managers Association (EMA), the UK professional body for energy managers, says an energy budget should include forecast income, expenditure and capital for a cost centre. It should also line up with company strategy, objectives and performance measures, and be approved before the budget period starts.
In practice, that means deciding four things before you open a spreadsheet:
- Scope: which sites, meters and fuels are in (electricity, gas, fuel for fleet, heat, water if you track it).
- Owner: who signs it off and who answers for variances at site level.
- Period: most businesses budget on the financial year, with monthly checkpoints.
- Purpose: cost control only, or also a carbon budget that supports a net-zero target such as 2030.
Writing these down first stops the most common failure: a budget that finance built from invoices and operations cannot recognise from the meters.
Step 1: Gather 12 months of actuals
The EMA's guidance is to start with the previous 12 months of actual energy costs. A full year captures every season, so heating and cooling loads are not guessed.
For each site and each meter, collect:
- Consumption in kWh and cost, by billing period.
- Contract details: supplier, end date, unit rates, standing charges and any pass-through elements.
- Site drivers: occupancy, floor space, production output, operating hours and heating or cooling degree days (a measure of how cold or hot the weather was).
Then check the data itself. The EMA says to check bill completeness, allocations, billing periods, reconciliations, estimated reads and errors before the numbers go into a budget. A baseline built on an estimated read or a duplicate invoice carries that mistake into every month of next year.
This is the step where checking by hand breaks down as the estate grows. Fifty sites with twelve bills each is six hundred documents. EnerlyticsAI's Bills feature does automated bill validation and anomaly detection, so the baseline you budget from has already been through a check. Our guide on how to check business energy bills for errors lists what to look for, and missing meter reads explain why estimated bills appear in the first place.
Step 2: Understand what is on the bill
A forecast only works if you know which lines move with consumption and which do not. A large supplier's bill guide, for example, separates consumption, fixed, distribution, transmission, reconciliation, Climate Change Levy and VAT charges.
Group them into three buckets:
| Bucket | Typical lines | Moves with |
|---|---|---|
| Volume-driven | Unit charges for energy used | kWh consumed and unit rate |
| Fixed | Standing charges, capacity or availability charges | Days in period, contracted capacity |
| Pass-through and tax | Network and policy costs, Climate Change Levy, VAT | Regulation, your contract type |
Standing charges are the easiest to get right. When quoted in pence per day, the annual cost is the daily charge multiplied by the number of days, divided by 100. At 30p a day, that is 30 × 365 ÷ 100 = £109.50 a year per meter. It does not change if the site is closed for a month, so it belongs in the fixed bucket.
Step 3: Normalize the baseline
Last year's bills include things that will not repeat. The EMA says historical figures should have one-off events removed and replaced with business-as-usual figures. It names shutdowns, generator use, new equipment, extreme weather, refurbishments, closures and changes in operating hours.
Do this site by site and write each adjustment down, with the reason and the kWh effect. A short log is enough:
- Site 4, March: two-week line shutdown, remove an estimated 18,000 kWh and replace with the typical March level.
- Site 7, July to August: temporary cooling during a heatwave, replace with the typical summer level.
- Site 2, all year: opening hours extended from October, so annualize the new pattern rather than using the old one.
If you do not have a reliable "typical" level, half-hourly data is the best evidence. It shows the base load (what the site draws overnight and at weekends) and the working-day profile, so you can see what a normal week looks like instead of inferring it from a monthly total. Half Hourly Data in EnerlyticsAI gives you that view per site, and our half-hourly meter checks guide explains how to use it without being caught out by billing errors.
Step 4: Forecast consumption first, price second
This is the principle that separates a budget you can manage from one you can only explain afterwards. Forecast the quantity (kWh) and the price (pence per kWh plus fixed charges) separately. When actual spend differs from the budget, you then know whether the site used more energy than planned or whether the market moved.
The EMA says to estimate future consumption and cost from site equipment, building practices, operating cycles, degree days, occupancy, floor space and processes, and to document known events and their expected impact. New machinery, a second shift, a closed unit or an LED retrofit all go in as explicit adjustments to the normalized baseline.
A practical sequence for each site:
- Start with the normalized kWh baseline.
- Add or subtract known changes (new load, planned efficiency work, changed hours).
- Adjust for weather if the site has heating or cooling load, using degree days.
- Split the result by month, so the budget follows the seasonal profile rather than a flat twelfth.
A forecast built from half-hourly history is usually steadier than one built from monthly totals, because the shape of demand is visible. Our guides on energy demand forecasting and half-hourly cost forecasts go deeper, and the Predictive feature in EnerlyticsAI is built for this kind of forward view.
Step 5: Price the forecast according to your contract
How you price consumption depends on what you have signed. The EMA says that for fixed contracts you apply the contract rates to the forecast consumption. For flexible or pass-through contracts, you estimate third-party and volatile wholesale costs separately, using risk tolerances for the uncertain elements.
The EMA's procurement guide frames the trade-off: it describes procurement as a balance between savings and budget certainty, and the two are difficult to maximize at once. The same guide says planning should assess budget requirements, legislation or policy, supply and consumption information and your risk framework or minimum hedge position before you choose contract length or fixed versus flexible purchasing.
For the budget, that gives you a simple rule: the more of your price that is fixed, the narrower your price range, and the more your variances will come from consumption. The more flexible your contract, the more you should show a base case and a range, with the range agreed with finance in advance.
A worked example
The figures below are illustrative, not market rates. One site, one electricity meter:
| Line | Calculation | Annual cost |
|---|---|---|
| Normalized baseline | 400,000 kWh | |
| Known change: new packing line | +30,000 kWh | |
| Known change: LED retrofit | −25,000 kWh | |
| Forecast consumption | 405,000 kWh | |
| Unit charge | 405,000 kWh × £0.25 | £101,250 |
| Standing charge | 30p × 365 ÷ 100 | £109.50 |
| Pass-through and levies (estimate) | agreed with finance | £6,000 |
| Budget before VAT | £107,359.50 |
Now the site finishes the year at 420,000 kWh and the unit rate was as contracted. The overspend is 15,000 kWh × £0.25 = £3,750, a consumption variance that the site team can investigate. If the consumption had matched the forecast and the pass-through costs had come in higher, that variance belongs to procurement and finance. Separating the two makes each conversation shorter.
Step 6: Track variances monthly, site by site
A budget is only useful if you compare it with actuals often enough to act. The former Department of Energy and Climate Change guide to the Energy Savings Opportunity Scheme recommends capturing spend and consumption for every energy supply monthly, storing the data electronically and centrally, and using sub-metering at larger companies where you need detailed visibility. It also notes that energy bureaus or software platforms can help organizations with large data volumes to store data, track usage, understand patterns and spot emerging trends.

The Carbon Trust recommends that most SMEs take monthly meter readings to track usage and check bill accuracy. It also advises investigating significant changes against comparable periods and calculating electricity and gas intensity separately in kWh per square metre. Intensity is what lets you compare a small office with a large warehouse on equal terms.
A monthly review that takes under an hour:
- Compare actual kWh and cost with budget, per site and per fuel.
- Mark any variance above the threshold you set (for example 5% or a fixed £ amount).
- Split each flagged variance into consumption, price and fixed-charge effects.
- Assign an owner and a due date for each investigation.
- Update the forecast for the rest of the year if the cause is permanent.
When the cause is behavioral, the Carbon Trust's advice is to take corrective action where procedures are not being followed, such as refresher training and reminders to switch off lights and equipment. When it is a billing error, you want to find it inside the dispute window, not at year end; see our guide to challenging a wrong meter reading.
Some sites also add hardware measures to cut load once monitoring shows where it sits, such as energy saving devices for commercial properties. The budget then records the expected kWh reduction, and the monthly review tests it.
For an estate of many sites, the Sites view in EnerlyticsAI keeps every location's consumption in one place, and our multi-site energy management roadmap shows how to sequence the work. If you are still deciding what to measure and how often, start with the energy monitoring strategy. Access to your own half-hourly records is covered in smart meter data access for UK businesses.
Step 7: Connect the budget to carbon reporting
The consumption you have just verified is also the activity data for your emissions inventory. The Department for Energy Security and Net Zero (DESNZ) describes the scopes this way: Scope 1 is direct emissions from sources the organization owns or controls, Scope 2 is indirect emissions from purchased electricity and heat, and Scope 3 is other indirect emissions in the value chain.
For a business energy budget, the mapping is straightforward:
- Scope 1: gas burned on site, fuel for company-owned vehicles and generators.
- Scope 2: purchased electricity and heat, the largest line in many budgets.
- Scope 3: the wider value chain, for instance business travel, which sits outside most energy budgets but inside a net-zero plan.
DESNZ says Scope 1 and 2 are generally more straightforward to measure, whereas Scope 3 is harder because methods and conversion factors still need development. It adds that comprehensive Scope 3 measurement can reveal the highest-emitting opportunities for improvement. So the sensible order is to lock in Scopes 1 and 2 from your verified energy data, then extend into Scope 3 categories one at a time.
Keeping the budget and the carbon inventory on the same dataset has a practical payoff: when a site's kWh falls, the cost line and the Scope 2 line move together, and you can show a board both effects from one source. EnerlyticsAI's Reports cover carbon reporting for Scopes 1, 2 and 3 alongside consumption analytics.
Common mistakes in energy budgets
- Budgeting from unchecked bills. Estimated reads and billing errors become your baseline.
- One flat number per year. Seasonal sites get false variances every winter and summer.
- Mixing price and volume. An overspend you cannot attribute cannot be fixed.
- Leaving one-offs in. A shutdown year makes next year's budget too low; a heatwave year makes it too high.
- No owner per site. A variance with no named person is a variance that repeats.
- Budget and carbon plan built separately. The two disagree by the time the board sees them.
Perspective
Most budget problems we see described by finance and facilities teams start before the forecast: nobody is certain the bills underneath are right. We built EnerlyticsAI around that point. Automated bill validation and anomaly detection come first, because a budget is only as good as the actuals it starts from.
Our view is that you should not need a large software contract to get this right. That is why the Starter plan is free forever and lets you manage multiple sites. You can put your real data in, see half-hourly consumption, and build the budget on checked numbers before you spend anything.
When the estate grows or reporting needs deepen, the paid plans are there: Eco at £49 per month, Growth at £79, Professional at £149 and Scale at £299. Whatever the plan, the idea is the same: one source of truth for cost, consumption and carbon.
Chris
Start your budget on checked data
If you are building next year's budget now, the quickest improvement is a verified baseline. Create a free account, add your sites, and let the platform validate your bills and show half-hourly consumption before you forecast. The Starter plan is free forever, and paid plans start at £49 per month (Eco) when you need more.
FAQ
What is an energy budget for a business?
It is a forecast of energy consumption and cost per site, set before the period starts and approved by the business. The EMA describes it as covering forecast income, expenditure and capital for a cost centre, tied to company strategy and performance measures. It is then compared with actuals through the year.
How do I forecast energy costs for next year?
Start from 12 months of verified actual consumption, remove one-off events, and add known changes such as new equipment or different operating hours. Forecast kWh first, then apply your contract rates and add fixed and pass-through charges. For flexible contracts, show a base case and a range.
How often should I compare actuals with the budget?
Monthly is the practical minimum for most businesses. The Carbon Trust recommends monthly meter readings for most SMEs, and the DECC guide recommends capturing spend and consumption for every supply each month. Sites with half-hourly meters can be reviewed more often if the data is available.
Should the energy budget include carbon?
It helps to. Electricity and gas data already feed Scope 2 and Scope 1 figures, so using one dataset for both avoids contradictions between the finance view and the net-zero plan. Scope 3 can be added category by category as your methods mature.
Sources
- Managing an Energy Budget, Energy Managers Association (2017)
- Energy Managers Guide to Electricity Procurement, Energy Managers Association
- Understanding your bill, EDF business bill guide (2025)
- A Guide to Implementing Energy Savings Opportunities, DECC (2015)
- Effective energy management for business, Carbon Trust (2019)
- Emissions measurement and reporting approaches, DESNZ (2024)