
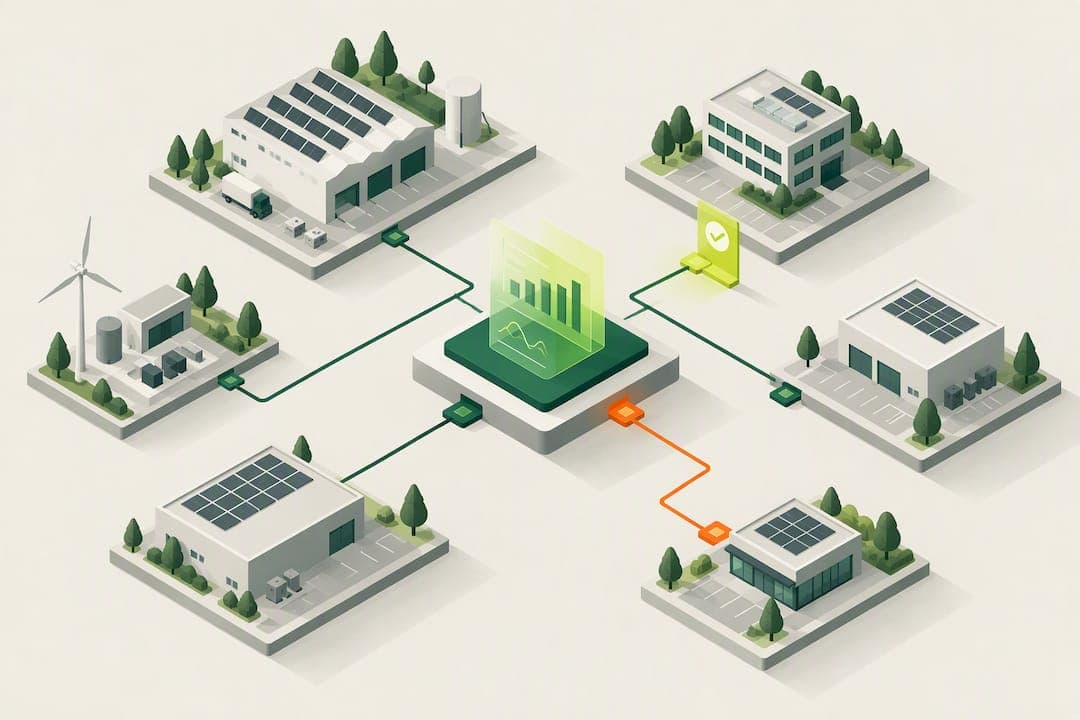
Multisite energy management centralizes half-hourly data and analytics so portfolio teams can spot faults faster, cut cost, and standardize operations across every location. Done well, it turns scattered meter readings into a single, trustworthy picture of performance, grounded in government estimates of what smart data can achieve. The rest of this guide walks through the data, the analytics, and the rollout steps that make it work.
TL;DR:
- Accurate half-hourly metering and clear estimation labeling are essential for trustworthy analytics and compliance during audits.
- Peer group normalization and key metrics like out-of-hours use reveal operational inefficiencies and inform retrofit priorities.
- Regression analysis and CUSUM charts are crucial for validating real savings and avoiding misinterpretation of seasonal effects.
- Prioritizing high-consumption sites, existing metering, and quick-win locations accelerates effective initial rollout and stakeholder buy-in.
- The free EnerlyticsAI plan allows organizations to test multisite management before investing in paid options or system customization.
Table of Contents
- Why multisite energy management matters
- Data and metering: what to collect and how to trust it
- Analytics and reporting: benchmarks, outliers, and performance testing
- Implementation roadmap: sites, technology, and integration
- Governance and compliance: ESOS, ISO 50001, and auditability
- Practitioner use case: how EnerlyticsAI supports multisite operations
- Reporting tailored to stakeholders and ROI impacts
- Integration with demand response and load management strategies
- Renewable energy and on-site generation in multisite management
- Data security and privacy in centralized energy management
- Stakeholder engagement and change management for adoption
- Software and platform selection criteria
- Capex and opex budgeting for multisite projects
- Author perspective: prioritizing people and process as much as software
- Manage every site from one free EnerlyticsAI account
- FAQ
- Sources
Why multisite energy management matters
Organizations running several sites face three overlapping pressures: rising energy costs, operational risk from equipment left running out of hours, and mounting sustainability reporting obligations. Centralized energy management addresses all three by giving facility and finance teams one source of truth instead of dozens of disconnected invoices and meter reads.
The financial case is often the easiest to make. A single site with a stuck chiller or a timer fault can burn through a budget line in weeks, and nobody notices until the bill arrives. Centralized monitoring catches that drift early, before it becomes a pattern across the portfolio.
The UK government's consultation on smart meter data estimates that smart meter access can support average reductions of around 8% on electricity and 4.5% on gas for non-domestic customers, framed explicitly as estimates rather than guarantees.
Stakeholders tend to care about a short list of numbers:
- Cost per site, normalized by floor area or output.
- Baseline kWh against which future performance is measured.
- Out-of-hours consumption as a share of total use.
Centralized control also reduces reactive maintenance. When a dashboard flags an anomaly the same day it starts, a facilities team can investigate before a small fault becomes an emergency repair.
Data and metering: what to collect and how to trust it
Good analytics start with a clear meter hierarchy. Boundary or fiscal meters measure what the supplier bills, while sub-meters break consumption down by building, floor, or process. Advanced metering infrastructure and smart meters under the SMETS specification feed much of this data automatically, but automation does not guarantee accuracy.
Half-hourly data is the backbone of serious multisite analysis because it reveals load shape, not just totals. Market procedures under the Market-wide Half-Hourly Settlement program set out detailed validation and estimation rules for how half-hourly readings get checked, estimated when a meter fails to report, and reconciled later. Any platform built on this data should mirror those controls rather than presenting estimated readings as if they were measured.
The government estimates smart meter access can support average reductions of roughly 8% on electricity and 4.5% on gas for non-domestic customers, which reminds us that data visibility alone is the lever, not a guaranteed outcome.
To keep multisite data trustworthy, we recommend four habits:
- Label every estimated interval clearly so analysts never mistake it for a measured reading.
- Keep an audit trail that shows when and why an estimation was applied.
- Preserve raw feeds alongside cleaned data so a disputed figure can be traced back to its source.
- Document the estimation hierarchy used for missing data, whether that is a prior-period benchmark or a degree-day adjustment.
These steps matter most when a figure feeds into a compliance report or a capital decision, where a defensible paper trail protects the organization during an audit.
Analytics and reporting: benchmarks, outliers, and performance testing
Raw consumption numbers mean little until they are compared against something fair. Energy Systems Catapult guidance recommends building peer groups around building archetype and activity, then normalizing by floor area or occupancy using intensity metrics such as kWh per square meter. A portfolio ranking built without that normalization will misdirect retrofit capital toward the wrong sites.
Once peer groups are defensible, three comparison techniques do most of the work:
- Daily, weekly, and monthly profile comparisons that expose baseload creep and out-of-hours waste.
- Regression analysis that tests whether a change in consumption tracks a real driver, like weather or occupancy, rather than noise.
- CUSUM charts that show whether a cumulative deviation from baseline is a sustained shift or a blip.
The Carbon Trust's buyer's guide points to exactly these two tests, regression and CUSUM, as the way larger organizations confirm whether an intervention produced a meaningful change rather than a seasonal coincidence.
Automated anomaly detection fits best as a triage layer: it flags the outliers, but a named owner, usually a facilities engineer or regional energy lead, still has to investigate and close the loop.
Pro Tip: Run a regression test before celebrating a savings result; a mild winter can look exactly like a successful retrofit until the weather normalization strips it out.
Implementation roadmap: sites, technology, and integration
A workable rollout starts with a baseline inventory. Most portfolios find that a small share of sites accounts for the majority of consumption, so metering those first captures the bulk of the opportunity quickly.
A simple prioritization rubric helps sequence the work:
- Rank sites by opportunity size, using spend or consumption as the first filter.
- Check metering readiness: sites with existing half-hourly feeds move faster than those needing new hardware.
- Favor low-hassle wins first, such as sites already on smart tariffs, to build momentum and internal buy-in.
- Schedule harder integrations, like legacy building energy management systems, once the program has a track record.
Integration checklist items worth confirming before rollout: links to building energy management and automatic monitoring and targeting (AM&T) systems, reliable half-hourly data feeds, connections into maintenance or ERP systems for work-order triggers, and open APIs so finance and sustainability tools can pull the same numbers without re-entry.
Ownership matters as much as the technology. Define who stewards each dashboard, who responds to alerts, and how often the governance group reviews performance, monthly is common for a mid-size portfolio.
Governance and compliance: ESOS, ISO 50001, and auditability
Multisite data has a second job beyond operations: supporting compliance. The ESOS good practice guidance expects organizations to identify areas of significant energy consumption across their estate and keep documented measurements ready for audit.
Organizations already certified to ISO 50001 can often use that route instead of a standalone ESOS audit, provided the energy management system covers the required consumption and reporting scope.
Audit-ready recordkeeping tends to include:
- Clearly labeled estimation methods for any gaps in metered data.
- Evidence trails a lead assessor can review without needing the original analyst present.
- Traceable meter data that links a reported figure back to its raw source reading.
Treating these records as a routine byproduct of monthly reporting, rather than a scramble before a compliance deadline, saves considerable work later.
Practitioner use case: how EnerlyticsAI supports multisite operations
The platform operationalizes the steps above: automated bill validation and anomaly detection catch billing errors and consumption spikes early, half-hourly analytics expose load shape at each site, and carbon reporting covers Scope 1, 2, and 3 emissions in one place.
A typical cycle looks like this: a baseline report establishes normal consumption for each site, automated alerts flag deviations as they happen, a facilities team reviews flagged sites and decides whether a retrofit is justified, and the next billing cycle's half-hourly data confirms whether the change produced a real, sustained reduction rather than a seasonal shift.

That loop, baseline, alert, decision, verification, is the same cycle any defensible multisite program needs, whatever tools sit behind it.
Reporting tailored to stakeholders and ROI impacts
A single dashboard rarely satisfies everyone who needs portfolio data. Finance wants cost per site and variance against budget. Engineering wants alarm-level detail on equipment behavior. Sustainability teams want emissions intensity and progress against targets. The Carbon Trust's guidance is explicit that reporting should be designed around the decision-maker rather than built as one monolithic view.
In practice, that means the same underlying half-hourly dataset gets sliced three or four different ways. A finance report might show monthly spend trends and flag sites running above budget. An engineering view might show intraday load profiles with alarm thresholds overlaid. A board-level sustainability report might roll everything up into a handful of intensity metrics and year-over-year trend lines.
ROI conversations work best when they tie a specific action to a specific, measured outcome. A lighting retrofit at one site, verified through a regression-adjusted before-and-after comparison, is a far stronger budget justification than a portfolio-wide average that mixes dozens of unrelated changes. Operations impact matters too: a facilities team that receives the right alert at the right time avoids both wasted energy and wasted labor chasing false alarms.
Reports built from role-specific templates tend to get used consistently, because each audience sees only the metrics relevant to their decisions rather than wading through a dense spreadsheet built for someone else.
Integration with demand response and load management strategies
Centralized visibility across a portfolio also opens the door to demand response participation, shifting or curtailing load during peak periods in exchange for payments or avoided peak charges. A site that can see its half-hourly load profile in real time is in a far better position to identify flexible load, equipment that can be shifted or paused without affecting operations, than one relying on monthly bills.
Load management at the portfolio level means more than responding to one grid signal. It means understanding which sites have genuine flexibility, whether that is battery storage, adjustable HVAC setpoints, or process equipment that can run on a delay, and coordinating those responses so the organization captures the opportunity without disrupting operations at any single site.
This is where the earlier data-quality work pays off again. Demand response commitments depend on being able to prove what happened during an event window, and that proof requires the same half-hourly granularity and audit trail used for routine benchmarking. A platform that already labels estimated intervals and preserves raw feeds is far better positioned to support a demand response contract than one that only reports monthly totals after the fact.
Renewable energy and on-site generation in multisite management
On-site generation, rooftop solar, small wind, or combined heat and power, adds a layer of complexity to multisite monitoring because consumption and generation now need to be tracked separately and then netted against grid import. A site generating a meaningful share of its own power can look artificially efficient on a simple consumption chart, when the real story is a shift in where the energy comes from rather than how much is used.
Portfolio teams managing a mix of generating and non-generating sites need intensity metrics that separate gross consumption from net grid draw, otherwise benchmarking across the estate becomes misleading. A site with solar panels should be compared against its own generation-adjusted baseline, not ranked directly against a site with no on-site generation.
Renewable generation also interacts with the carbon reporting side of multisite management. Scope 2 emissions calculations depend on knowing how much of a site's consumption came from the grid versus on-site renewable sources, so accurate sub-metering between generation and consumption meters becomes part of the data-quality discipline discussed earlier, not a separate workstream.
Data security and privacy in centralized energy management
Centralizing energy data from dozens or hundreds of sites concentrates a meaningful amount of operational information in one system: consumption patterns, occupancy signals inferred from load shape, and billing details tied to specific locations. That concentration raises the stakes if access controls are weak.
Role-based access matters as much in energy platforms as in any other business system. A regional facilities manager may need full detail for their sites, while a board member reviewing portfolio-level sustainability metrics needs only aggregated figures. Granting broader access than a role requires increases risk without adding value.

Half-hourly data in particular can reveal operational patterns, when a site opens, closes, or runs at reduced capacity, that an organization may not want exposed beyond the people who need it for energy management. Encryption in transit and at rest, clear data retention policies, and audit logs showing who accessed what and when are baseline expectations for any system holding this volume of site-level detail.
Stakeholder engagement and change management for adoption
The best dashboard in the world fails if nobody acts on what it shows. Multisite energy programs tend to succeed or stall based on whether the people closest to each site feel ownership over the data, not just the regional or head-office team reviewing monthly summaries.
Early engagement works better than a top-down mandate. Involving site-level facilities staff in defining what counts as a meaningful alert, rather than imposing thresholds from a central team with no visibility into local quirks, reduces alert fatigue and builds trust in the system.
Change management also means being honest about what the data will expose. A site that has been quietly running inefficiently for years may see that habit surface in a benchmarking report for the first time. Framing this as an opportunity to fix a known gap, rather than as a performance review, keeps local teams engaged rather than defensive.
Regular, short governance reviews, monthly rather than quarterly, keep the program visible and give site teams a predictable forum to raise data-quality issues or push back on a flagged anomaly that turned out to have a legitimate operational cause.
Software and platform selection criteria
Choosing a platform for a multisite rollout comes down to a handful of practical questions rather than a feature checklist. Does it ingest half-hourly data directly from meters and suppliers, or does it rely on manual uploads that introduce delay and error? Does it support the benchmarking and statistical testing, intensity metrics, regression, CUSUM, that make results defensible rather than anecdotal? Can reporting be tailored by role, so finance, engineering, and sustainability teams each see what they need?
Data quality controls deserve particular scrutiny during selection. A platform should clearly label estimated versus measured intervals and keep an audit trail, mirroring the validation and estimation rules set out in UK market procedures for half-hourly settlement data. A platform that presents everything as a clean number, with no distinction between measured and estimated, makes it harder to trust the analysis built on top of it.
Operational fit matters beyond the energy team too. Facilities teams managing HVAC and building systems across sites often track their own operational KPIs, and a platform that can align its intensity metrics with those operational benchmarks makes cross-team buy-in easier to secure.
Capex and opex budgeting for multisite projects
Multisite energy programs carry two distinct cost profiles that are easy to blur together in a business case. Capital expenditure covers the one-time costs, metering hardware, sub-metering installation, building energy management system upgrades, and any physical retrofit work like lighting or HVAC replacement. Operating expenditure covers the ongoing costs: software subscriptions, data connectivity, and the staff time needed to review dashboards and act on alerts.
A common budgeting mistake is approving the capital spend for better metering without planning for the recurring analyst or facilities time needed to actually use the data. A half-hourly feed that nobody reviews produces no savings, regardless of how much was spent installing it.
Phasing capex against the prioritization rubric described earlier, largest opportunity sites first, helps spread spend across budget cycles while still capturing the bulk of available savings early. Opex planning should account for the governance cadence itself: monthly review meetings, alert response time, and periodic benchmarking refreshes all carry a real, if modest, ongoing cost that should sit in the same budget line as the software itself.
Author perspective: prioritizing people and process as much as software
The platforms and the half-hourly feeds get most of the attention, but the programs that actually save money are the ones with a named owner for every dashboard and a routine for acting on alerts. Software without process just produces a prettier version of the same ignored report.
— Chris
Manage every site from one free EnerlyticsAI account
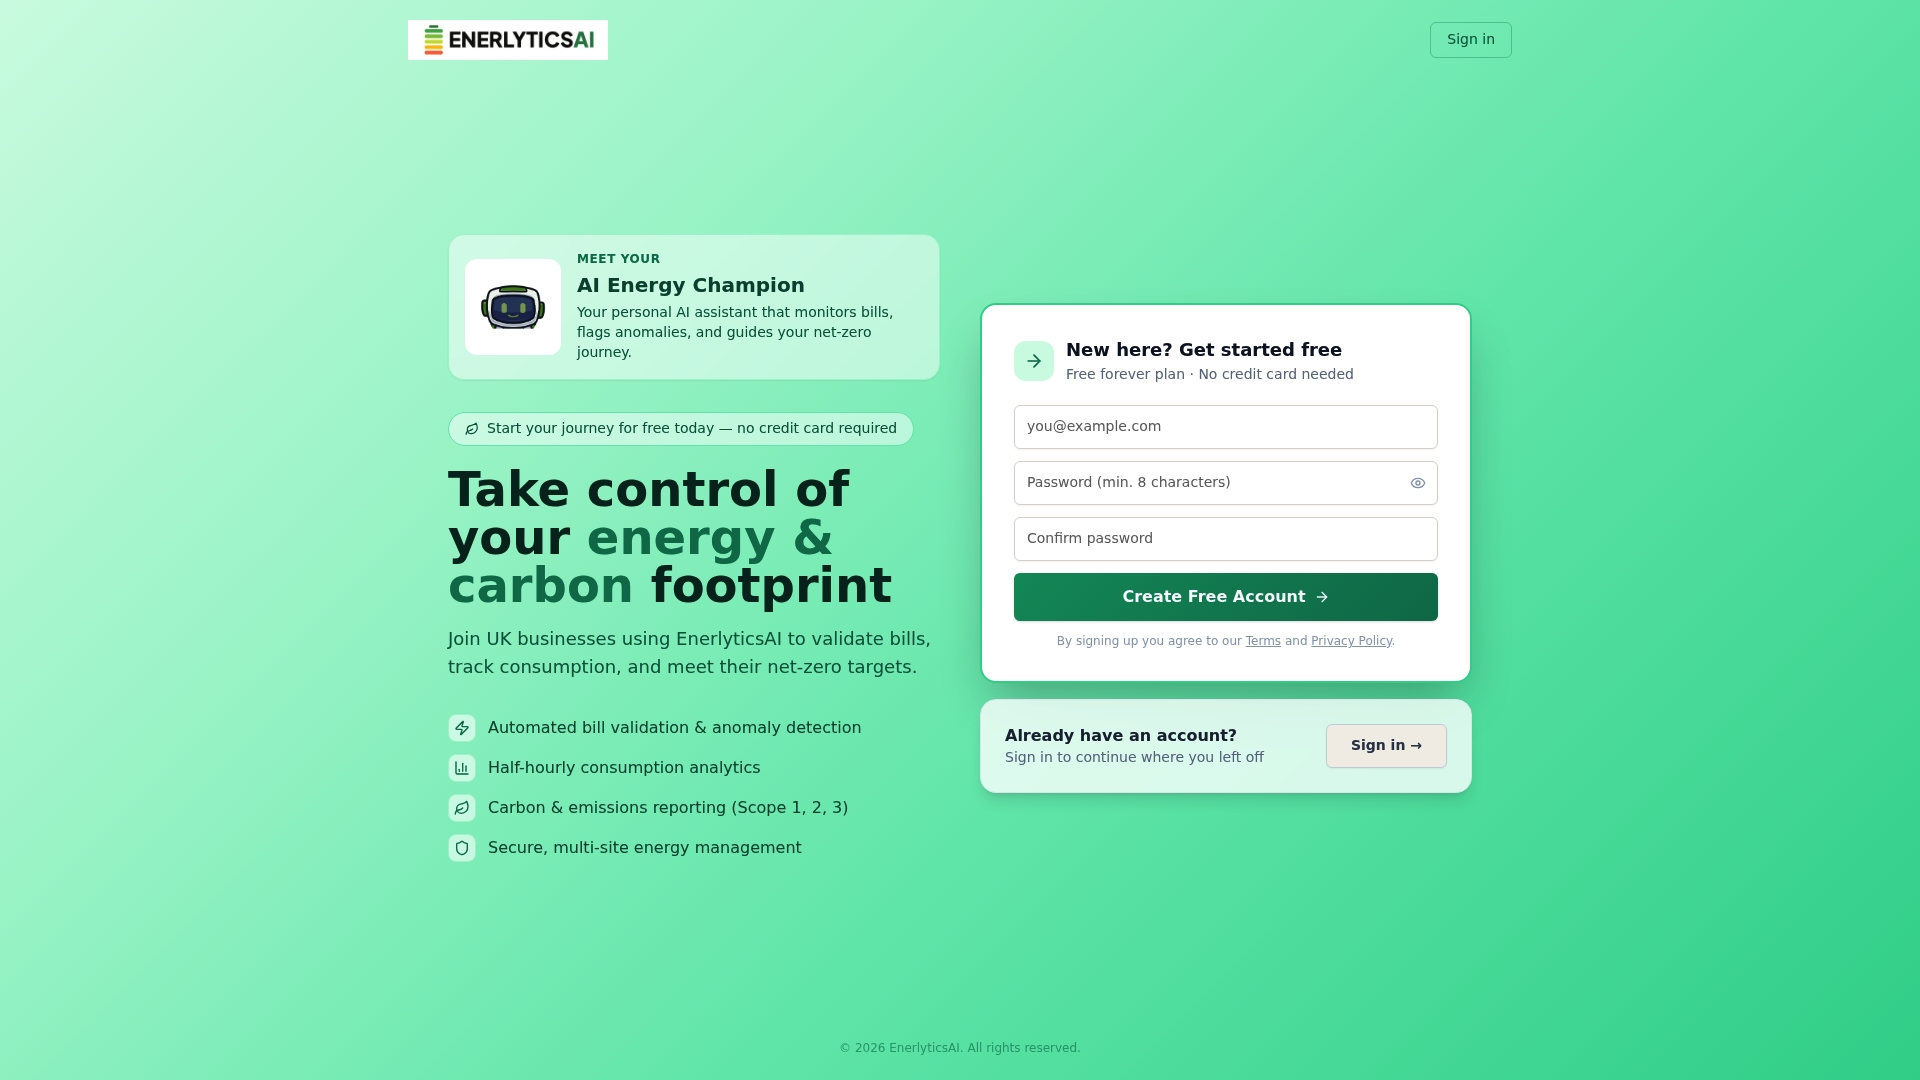
The platform is designed so that managing energy across multiple sites does not require a procurement process before you even see the data. The Free forever plan (Starter) gives you access to core usage at no cost, so you can connect your sites and see what the data actually shows before committing to anything.
Getting started takes three practical steps:
- Register for the free starter plan and add your first sites.
- Connect your half-hourly data feeds so analytics have something real to work with.
- Run your baseline report to see current performance before chasing any retrofit decisions.
From there, upgrading to a paid tier only makes sense once your portfolio's needs genuinely outgrow the free plan.
FAQ
What is multisite energy management?
Multisite energy management is the practice of centralizing energy data, usually half-hourly consumption, billing, and carbon figures, from multiple locations into one system for monitoring, benchmarking, and reporting. It replaces separate, site-by-site tracking with a single portfolio view that supports faster fault detection and consistent reporting.
How much energy can smart meter data actually save?
The UK government's consultation on non-domestic smart meters estimates average reductions of around 8% for electricity and 4.5% for gas, based on improved visibility into consumption patterns. These are estimates tied to data access, not a guaranteed outcome for every site.
How do I know if a performance change is real or just noise?
Regression analysis and CUSUM charts are the two tests recommended by the Carbon Trust for larger organizations to confirm whether a change in consumption reflects a genuine shift rather than weather or seasonal variation. Running either test before attributing savings to an intervention protects a business case from being challenged later.
Does ISO 50001 replace the need for ESOS compliance?
Organizations certified to ISO 50001 can often use that certification as a compliance route instead of a separate ESOS audit, provided the energy management system's scope covers the required areas of significant consumption. The ESOS good practice guidance sets out what that coverage needs to demonstrate.
What does EnerlyticsAI cost to get started?
The Free forever plan (Starter) costs nothing and covers core multisite usage. Paid tiers, Eco at £49 per month, Growth at £79 per month, Professional at £149 per month, and Scale at £299 per month, add advanced features as portfolio needs grow.
Sources
- Non-domestic smart meter rollout post-2025: consultation document
- Understanding your energy data — Energy Systems Catapult
- Digital technologies for energy management: a buyer's guide — Carbon Trust
- Data retrieval and processing for smart segment metering systems (MHHS / BSCP701)