
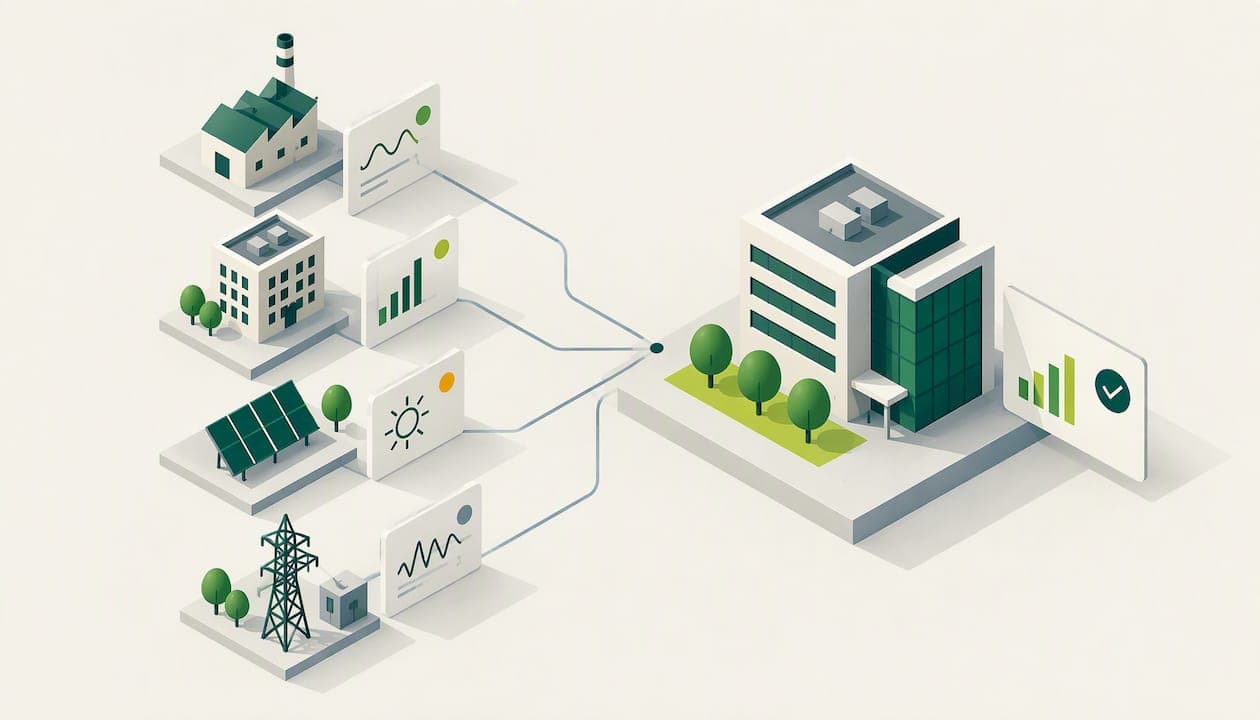
An energy monitoring strategy is a written plan for what you measure, how often, who looks at the data and what happens when the numbers move. For a UK business the sensible order is: define the boundary of what you control, start with half-hourly data for each site, add sub-meters only where the biggest or most uncertain loads sit, then set alerts and a review rhythm so the data leads to action. This guide walks through that plan step by step, including the metering side, usage alerts and how the same data feeds Scope 1, 2 and 3 reporting.
TL;DR
- Decide the metering boundary first, then choose meters. Buying hardware before you know what you need to answer is the most common and most expensive mistake.
- Start with the most granular, automated data you can get: half-hourly electricity for every site, then heating fuel, then sub-meters on large loads.
- Compare readings with history, benchmarks and targets. A single reading tells you little; a pattern tells you a lot.
- Set alerts on a small number of meaningful triggers (baseload creep, out-of-hours use, missing reads, bill mismatches) and give each one an owner.
- Write the plan down and review it. Sites, tariffs and equipment change, and a monitoring plan has to change with them.
Table of Contents
- Why a monitoring strategy beats a pile of meters
- Step 1: Set the boundary and the questions
- Step 2: What to measure, in order
- Step 3: Choose meters and connect the data
- Step 4: Analyze the data so it finds money
- Step 5: Set usage alerts that people act on
- Step 6: Turn monitoring into cost, Scope 1, 2 and 3 numbers
- Our perspective
- Step 7: Review and improve the plan
- Where our platform fits
- FAQ
- Sources
Why a monitoring strategy beats a pile of meters
Most businesses already have some data: monthly bills, a smart meter or two, perhaps a dashboard from a supplier. What they lack is a plan that links that data to decisions. Without one, readings get looked at when a bill looks high and forgotten afterwards.
The UK Government's guide for the public sector lists the basic gains from smart metering: automatic supplier readings, better visibility of usage and spend, and a chance to change energy-related behaviour. The same guide notes that half-hourly data supports half-hourly settlement in place of estimates, which can help make the electricity system cheaper and more efficient. The guide is written for public bodies, but the logic applies to any organisation paying for electricity.
CIBSE's TM39 guidance on building metering and monitoring, published in May 2026, goes further. It says good metering gives reliable evidence of building performance, supports energy management and benchmarking, and underpins climate-related disclosure and legislative compliance. In other words, measurement is not just a billing function. It is the evidence base for cost control, for reporting and for your net-zero plan.
Three questions make a good test of whether you have a strategy or just data:
- Can you say, for each site, what it uses overnight and what it should use?
- Would you find out within days, not at the next bill, if a meter stopped reporting or a charge looked wrong?
- Can you give an auditor or a customer a carbon figure for a single building and show where it came from?
If any answer is "not really", the steps below are for you.
Step 1: Set the boundary and the questions
CIBSE's guidance is clear on the order of work: survey the building infrastructure, define the metering boundary and settle the metering strategy before deciding which items to meter. The UK Business Climate Hub gives a similar starting point for smaller firms: measure energy use in the areas you control, using bills, smart meters, sub-meters or a professional monitoring system.
In practice, write down:
- The boundary. Which sites, which meters, which fuels. Include leased space only where you pay for the energy or must report it.
- The questions. Typical ones are: what does each site cost us per month, which site is the outlier, what is our baseload, are we billed correctly, and what are our Scope 1 and 2 emissions?
- The audience. Finance wants accurate costs and accruals. Facilities wants faults and waste. Sustainability wants emissions by site. One dataset can serve all three, but only if it is defined that way from the start.
This half-page document is the core of your strategy. Everything below turns it into practice.
Step 2: What to measure, in order
The temptation is to meter everything. Resist it. A staged order gets you useful answers quickly and shows which sub-meters are worth paying for.
1. Whole-site electricity, half-hourly
Half-hourly data shows when you use power, not just how much. It is the single most useful dataset for finding out-of-hours waste, baseload creep and demand peaks. Energy Systems Catapult's Understanding Your Energy Data guide recommends starting with the most granular and automated data available, then applying benchmarks and weather or occupancy adjustments where they make sense.
If your sites have smart or advanced meters, you may already be able to get this data. Our guide to smart meter data access for UK businesses sets out the routes.
2. Gas and other heating fuel
Heating is often the largest Scope 1 source for a multi-site business. Monthly gas readings are a fair start, but daily or half-hourly data lets you relate consumption to weather and occupancy. If you run boilers, our piece on boiler efficiency tracking with half-hourly data shows what to look for.
3. Sub-meters on the biggest or least understood loads
Once the whole-site picture is clear, add sub-meters where they answer a real question: a production line, a compressor room, refrigeration, a data room, an EV charging area, a tenant's floor. Temporary meters are a legitimate first step. CIBSE's guidance explicitly includes temporary meters, tenant billing, utility-bill validation, data visualisation, analytics and ongoing commissioning as parts of a practical monitoring system, so a short logging exercise before a permanent install is good practice, not a shortcut.

4. Fleet and other fuels
For fleet management and on-site fuel, record litres or kWh by vehicle or depot from fuel cards and charging records. These feed Scope 1 (fuel you burn) and, for charging, Scope 2 (electricity you buy).
A staged plan at a glance
| Stage | What to meter | Question it answers | Typical data frequency |
|---|---|---|---|
| 1 | Whole-site electricity | When do we use power, and what is our baseload? | Half-hourly |
| 2 | Gas and heating fuel | How does heat demand track weather and occupancy? | Daily or half-hourly where available |
| 3 | Sub-meters on large loads | Which equipment drives cost and carbon? | Half-hourly or finer |
| 4 | Fleet and other fuels | What are our direct fuel emissions? | Per fill or per charge |
Step 3: Choose meters and connect the data
CIBSE's process runs from surveying and boundary-setting through to documenting energy flows, deciding what to meter, selecting meters and communications, and planning data collection, visualisation, commissioning and documentation. Three practical points for UK sites:
- Use what exists first. Supplier smart or advanced meters, pulse outputs and existing building management systems often provide data without new hardware.
- Plan the communications. A meter that cannot report reliably is a liability. Check signal, network access and who owns the connection before you buy.
- Commission and document. Record where each meter sits, what it measures, its multiplier and its owner. Undocumented meters become mystery numbers within a year.
Missing data is a real problem in this kind of programme. Our guide to UK meter data gaps explains how to spot missing reads before they become estimated bills.
Step 4: Analyze the data so it finds money
Data only pays back when it is compared with something. The Better Buildings Partnership's guidance on energy performance monitoring recommends comparing current consumption with historical data and benchmarks, comparing actual use with targets, and reviewing annual, monthly and seasonal patterns to investigate changes in peak-load times and baseload. The underlying point is that monitoring works when readings are repeatedly set against patterns, benchmarks and targets rather than viewed as isolated numbers.
A routine that works for most teams:
- Baseload check. Look at the lowest sustained demand at night and on weekends. If it creeps up over months, something is being left on or has failed. Our explainer on baseload versus peak load covers what each tells you.
- Operating-hours check. Overlay the occupied hours on the daily profile. Demand outside those hours is the first place to look for savings.
- Site comparison. Normalize by floor area, production output or degree days, then rank sites. The outlier is usually where an hour of attention pays most.
- Bill validation. Compare what you were billed with what the meter recorded, and check rates, standing charges, capacity charges and meter reference details. Our guide to half-hourly meter checks to avoid billing errors sets out the checks.
Where cooling is a significant driver of your summer demand, the building fabric matters as much as the equipment. A short read on the thermal performance of window films shows the kind of fabric measure whose effect you can then verify in your own consumption data.
A note on estimates
If you report under a scheme such as Climate Change Agreements, the rules on estimating are strict. The Environment Agency's Climate Change Agreements Operations Manual says gaps caused by meter failure may be estimated using accepted techniques, but a delayed supplier invoice is not a valid reason to estimate consumption, and regular readings of your own meters are good practice. Even outside such schemes, the habit of reading and checking your own data is worth keeping.
Step 5: Set usage alerts that people act on
Usage alerts are where a monitoring strategy becomes daily practice. The failure mode is familiar: too many alerts, all ignored. A better approach is a short list of triggers, each tied to a person and an action. We have found no single UK standard for alert thresholds, so treat the following as a starting framework to calibrate against your own history rather than fixed numbers.
| Trigger | What it usually signals | Who owns it |
|---|---|---|
| Overnight or weekend demand above your normal baseload | Equipment left running, a control fault, a failed timer | Facilities |
| Daily consumption well above the same weekday's recent pattern | A process change, a leak, a heating or cooling fault | Site manager |
| New demand peak above your usual maximum | A start-up sequence change, a failing motor, a new load | Facilities or engineering |
| Missing or flat-lined half-hourly data | A meter or communications fault; risk of estimated bills | Energy or data lead |
| Billed units or charges that do not match recorded data | A billing error or wrong meter details | Finance |
| A site far outside its peer group after normalization | A site-specific problem worth a visit | Sustainability or operations |
A few rules make alerts useful:
- Base thresholds on your own history. Use a rolling comparison against the same period and weekday, adjusted for weather or occupancy where relevant, rather than a single number for every site.
- Start with three or four alerts. Add more only once those get resolved quickly.
- Record the outcome. Each alert should end in "fixed", "expected" or "threshold changed". That log becomes the evidence that your monitoring pays for itself.
- Alert on silence. A meter that stops reporting is as important as a spike, because billing and carbon figures both depend on it.
Step 6: Turn monitoring into cost, Scope 1, 2 and 3 numbers
Monitoring data should feed your carbon reporting without a separate spreadsheet exercise. Energy Systems Catapult's guide advises calculating current-year emissions using Government conversion factors for company reporting, and using Green Book factors for net-zero strategy work. It also recommends calculating emissions at building or asset level so that large emitters can be prioritised for efficiency or decarbonisation measures. The aim is to reveal the assets and buildings that matter most, not just to produce a portfolio total.
How the data maps across the scopes:
- Scope 1: gas, other heating fuels, company vehicles and refrigerant losses. Metered or invoiced fuel volumes multiplied by the right factor.
- Scope 2: purchased electricity, heat or steam. Half-hourly electricity totals by site, with the factor basis stated.
- Scope 3: the wider chain, including purchased goods, waste, travel and, for some, tenant energy. Energy data helps most with the energy-related categories and with tenant or leased-space figures.
Factor choice is where audits often get stuck, so see our note on emissions factor selection and our carbon reporting basics for UK businesses. If you operate across several locations, the data-first multisite roadmap shows how to sequence the work. For heat, a heat decarbonisation plan is far easier to build on measured profiles than on estimates.
Our perspective
We build software for UK businesses that need to manage energy and carbon, and we see the same pattern in nearly every programme. Teams do not fail for lack of data. They fail because the data is scattered across supplier portals, bills and spreadsheets, so nobody trusts it enough to act on it.
Our view is that bill validation and half-hourly analytics belong together. A bill is the point where energy becomes money, and the half-hourly profile is the evidence behind it. When you can put the two side by side, billing errors, missing reads and unexplained spikes stop being arguments and become tasks.
We also believe the barrier to starting should be low. That is why our core platform is free to begin with, across multiple sites, so you can see your own data before deciding whether you need more. Start narrow: one set of sites, three alerts, one monthly review. Expand when the habit sticks, not before.
— Chris
Step 7: Review and improve the plan
A strategy that is never reviewed becomes a historical document. CIBSE advises reviewing the metering strategy before you proceed and using ongoing commissioning guidance to keep the system performing. The government's UK ETS guidance, UKETS13, shows what a mature version looks like: a monitoring methodology plan that documents data sources, collection, processing, meter maintenance and calibration, quality controls, archiving and improvement opportunities, and remains a living document as installations change. The wider message in that guidance is that short, controlled data flows, reliable meters and documented procedures are central to credible reporting and verification.
You do not need to be in the UK ETS to borrow the idea. A light version for most businesses:
- Monthly: review alert outcomes, missing data and bill mismatches.
- Quarterly: compare sites, check progress against targets and decide whether any sub-meter is worth adding.
- Annually: revisit the boundary, update factors, check meter documentation and reset targets.
- After any change: new site, new tariff, new equipment or a closed building should trigger an update to the plan.
Where our platform fits
EnerlyticsAI is built for this workflow: automated bill validation and anomaly detection, half-hourly consumption analytics, and carbon reporting across Scope 1, 2 and 3, with secure multi-site management. You can start on the free forever Starter plan and look at your bills, emissions and setup in one place before spending anything.
If you outgrow the free plan, paid tiers are Eco at £49 per month, Growth at £79 per month, Professional at £149 per month and Scale at £299 per month. The Bills and Emissions pages show how validation and carbon reporting work in practice.
FAQ
What should I measure first in an energy monitoring strategy?
Define your metering boundary, then start with half-hourly electricity for each whole site. Add heating fuel next, and sub-meters only on the largest or least understood loads. CIBSE's guidance puts the survey and boundary before any decision on what to meter.
How is an energy metering strategy different from a monitoring strategy?
Metering is the hardware and data collection: which meters, where, and how they communicate. Monitoring is what you do with the readings: comparison, alerts, reporting and review. A good plan covers both, because meters nobody analyzes save nothing.
Which energy usage alerts are worth setting?
Start with baseload above normal, out-of-hours consumption, new demand peaks, missing data and bill mismatches. Base thresholds on each site's own history, and give every alert an owner and a recorded outcome.
Do I need sub-meters?
Not at the start. Whole-site half-hourly data often reveals the main waste. Add permanent sub-meters when you have a specific load or tenant to understand, and consider temporary meters first to test whether the extra detail is worth paying for.
How often should I review the plan?
Review alerts and data quality monthly, site performance quarterly, and the whole plan annually. Also revisit it after any change to sites, tariffs or major equipment.
Sources
- An introductory guide to smart meters for the public sector (GOV.UK)
- TM39 Building Metering and Monitoring (CIBSE)
- Monitor performance using smart meters and management systems (UK Business Climate Hub)
- Understanding your energy data (Energy Systems Catapult)
- GN4.12 Energy performance monitoring (Better Buildings Partnership)
- Climate Change Agreements Operations Manual (Environment Agency)
- UKETS13 FAR: Monitoring and reporting (DESNZ)