
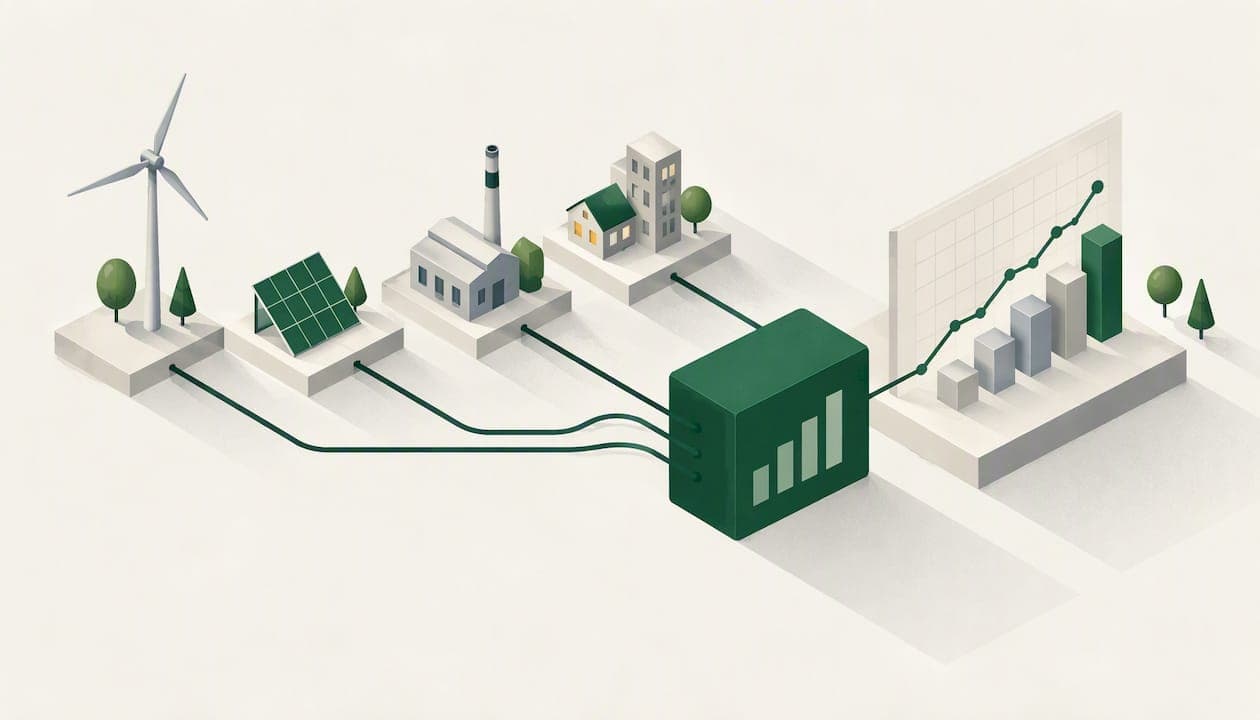
Energy demand forecasting is the practice of predicting how much electricity or gas will be needed at a future point, using past consumption, weather and calendar patterns. For a UK business, the useful version is simple: forecast your own sites' half-hourly consumption, compare it with what you are billed, and use the gap to budget, cut peaks and report emissions. This guide explains how the forecasts are built, where they go wrong and what a business can realistically do with them.
TL;DR
- Energy demand forecasting predicts future consumption from history, weather, calendar effects and planned changes. Grid operators do it nationally; businesses do it for their own sites.
- Horizons run from minutes to years. Most businesses need short-term (days) forecasts for operations and medium to long-term ones for budgets and net-zero planning.
- Poor inputs ruin forecasts: estimated reads, incomplete bills and unusual past events. Clean half-hourly data comes before clever models.
- Good forecasts feed cost control, peak management, multi-site comparison and Scope 1, 2 and 3 reporting.
- You can start with half-hourly data and bill checks on a free plan, then upgrade only when you need more.
Table of Contents
- What energy demand forecasting means
- Forecast horizons and which one you need
- How forecasts are built: data and methods
- Why business forecasts go wrong
- Half-hourly data is the foundation
- Using forecasts to control cost and peaks
- Forecasts, net zero and Scope 1, 2 and 3
- Our perspective
- Getting started with EnerlyticsAI
- FAQ
- Sources
What energy demand forecasting means
In Great Britain, the system operator describes forecasting as predicting how much energy consumers will require ahead of time, alongside expected generation, so markets and networks can run safely and efficiently. NESO publishes forecasts from real time to years ahead, and at national and local levels. Accurate forecasts help it maintain energy security, monitor spare capacity and balance the transmission system.
That is the national picture. A business forecast is a smaller version of the same idea. You are not balancing a grid, but you are balancing a budget, a contract and a carbon target. The questions are different:
- How much will each site use next week, next quarter, next financial year?
- What will that cost on our tariff?
- Which sites will drift from plan, and why?
- What will our electricity and gas emissions be at year end?
You will also see the term "load forecasting". It usually refers to electricity demand specifically, meaning how much power is needed at a given time and how that affects the network. Broader energy forecasting also covers fuel availability and prices. For a company, the working definition is any structured prediction of your own consumption and its cost.
Forecast horizons and which one you need
Academic work on short-term load forecasting in the UK sorts forecasts into four time-based categories: very short-term (seconds to minutes), short-term (hours to days), medium-term (days to months) and long-term (months to several years). Each supports a different decision. Very short-term forecasts support emergency control, short-term ones support generation and storage scheduling, medium-term ones support maintenance scheduling, and long-term ones support grid and generator planning.
Translated to a business, the picture looks like this:
| Horizon | Typical question | Who uses it |
|---|---|---|
| Next day to a week | Will tomorrow's load spike? Should we shift a process? | Facility and operations managers |
| Weeks to months | Are we on budget? Is maintenance affecting usage? | Finance and energy managers |
| 12 months or more | What will next year's energy cost and carbon look like? Which upgrades pay back? | Finance, sustainability, board |
NESO's own 7-day-ahead national forecast publishes cardinal points such as the overnight minimum, daytime peak, daytime minimum and evening peak. Those shapes are worth knowing because most commercial sites follow a version of them: a night-time baseload, a working-hours plateau and sometimes a start-up spike. Our guide to baseload versus peak load shows how to read those two numbers on your own meter.
How forecasts are built: data and methods
What goes in
For its day-ahead national demand forecast, NESO forecasts "virtual demand" (total underlying customer demand) from weather data, historical demand and time variables, then subtracts estimated embedded wind and solar. The ingredients are the same ones a business can use:
- Historical consumption, ideally half-hourly.
- Weather, especially temperature, for any site with heating or cooling.
- Calendar effects: weekdays, weekends, bank holidays, shutdown weeks, seasons.
- Planned changes: a new production line, a shift pattern, a site closure, an EV charging install.
The Met Office explains that useful forecasts start with weather-sensitivity analysis, pairing demand data with weather data to estimate how much weather moves demand, with forecasts up to 14 days ahead and longer-term scenarios beyond that. A warehouse with electric heating is highly weather-sensitive. A data hall or a chilled-food plant has a flat profile with a cooling bump in summer. Knowing which you are changes the model you need.
For long-range work, NESO builds UK electricity demand from components: industrial and commercial use, residential appliances and lighting, heating, transport and losses, with DESNZ Energy Trends data as a principal historical basis. You do not need that level of detail, but the principle holds: forecast by driver, not as one lump.
Which method
Regression, time-series and machine-learning models are all used. A 2025 review of electricity forecasting concludes that no single method is universally best: the choice depends on the problem, the time horizon and the data you have. In practice:
- Simple baselines (same period last year, adjusted for weather) beat many complicated models when data is short or messy.
- Regression with weather and calendar variables suits sites with stable operations.
- Machine-learning models earn their place when you have a long, clean half-hourly history and many sites to compare.
Start with the baseline. If a sophisticated model cannot beat last year's adjusted pattern, the problem is the data, not the algorithm.
Why business forecasts go wrong
The Energy Managers Association has pointed out that inaccurate business forecasts come from misallocated or incomplete bills, estimated reads, unusual past events, or failing to account for planned changes. Each deserves a closer look.
Estimated reads and gaps. If the history you forecast from contains estimates, the forecast inherits the error. Spotting missing readings before the bill is estimated is the cheapest accuracy gain available, and we cover it in our piece on UK meter data gaps.
Billing errors treated as real usage. A wrong rate, a duplicated charge or a meter assigned to the wrong site looks like consumption in a spreadsheet. Check bills against metered data first. Our guide to half-hourly meter checks explains what to look for.
One-off events baked into history. A plant outage, a refurbishment or a cold snap can distort a month. Flag them and either remove them or model them separately.
Ignored plans. Past data cannot know you are adding a second shift in March. Add planned changes as explicit adjustments.
At national level, NESO says short-term uncertainty is mainly tied to operational metering, weather forecasts, consumer behavior, and generator and network availability, and that beyond two weeks forecasts lean more on typical weather and underlying demand. The lesson transfers: expect accuracy to fall as the horizon lengthens, and widen your budget range accordingly.

Half-hourly data is the foundation
Smart meters record half-hourly consumption and price data, and that data can be collated on a common platform for visualization and tracking. Suppliers use half-hourly data to buy and pay for the electricity their customers use each half hour, known as half-hourly settlement. For a forecaster, 48 readings a day instead of one monthly total is the difference between seeing a profile and guessing at one.
What half-hourly data reveals:
- Baseload: what your sites draw when nobody is working. This is often where the quickest savings are.
- Peak timing: when demand spikes, and whether it coincides with the most expensive periods.
- Start-up and shutdown behavior: how long it takes a site to ramp, and whether equipment is left running.
- Anomalies: a profile that suddenly changes shape without a change in operations.
If you do not yet have access to your own interval data, our guide to smart meter data access for UK businesses walks through the options.
Using forecasts to control cost and peaks
The gov.uk guidance notes that time-of-use tariffs reward organizations for using energy away from peak times and can help lower bills. A forecast turns that from a general idea into a schedule: if you know tomorrow's profile, you can decide whether to move a batch process, pre-cool a store or delay a compressor cycle.
A hypothetical illustration of the logic (numbers invented for the example, not a benchmark): a site forecasts a weekday profile with a 90 kW baseload and a 240 kW late-afternoon peak. The forecast for next week is 8 percent higher because of a heatwave and a one-off order. Finance now has a defensible number for the monthly accrual, and operations can see that moving one process out of the afternoon would flatten the peak. Neither conclusion needs a sophisticated model, only a profile, a weather adjustment and a plan.
For finance teams, the same forecast converts to cost. Our article on half-hourly energy cost forecasts covers how to turn consumption forecasts into budget ranges so variances stop being surprises.
Forecasting across multiple sites
With several sites, forecasts do a second job: comparison. Normalize each site's consumption by weather and operating hours, and outliers stand out. A site that uses 20 percent more than its peers in the same conditions is either doing something different or wasting energy. Either answer is useful.
Practical steps for a multi-site portfolio:
- Put every meter on one platform with consistent site and meter naming.
- Forecast each site separately, then add them up for the portfolio view. Do not forecast the total only.
- Review variances monthly: forecast versus actual versus billed.
- Investigate any site whose variance repeats, since that usually points to a billing, metering or operational cause.
Forecasts, net zero and Scope 1, 2 and 3
Consumption forecasts are also emissions forecasts, because emissions are consumption multiplied by a conversion factor. The Carbon Trust notes that carbon calculations use specific conversion factors (kgCO2e per unit), which for UK grid electricity are set out by government reporting standards. Choosing the right factor and labeling it correctly matters at audit, which is why we wrote about emissions factor selection.
On the reporting side, the Carbon Trust explains that SECR requires quoted companies to report global energy use and greenhouse gas emissions, and large unquoted companies to report UK energy use and associated emissions, using a robust, transparent and widely accepted methodology. A forecast helps you see year-end figures before the reporting deadline, and lets you test whether a planned efficiency project moves you toward a 2030 target. For the wider reporting picture, see our carbon reporting basics and our note on CSRD carbon reporting.
How the scopes connect to demand forecasting:
- Scope 1: gas burned on site and fuel for company vehicles. Gas demand forecasts and fleet usage plans feed directly in.
- Scope 2: purchased electricity. This is the scope where half-hourly forecasts are most directly useful.
- Scope 3: everything else in the value chain, from purchased goods to waste. Energy data is one input among many, and some categories need their own methods. If waste is a large category for you, this guide on how to measure waste emissions for Scope 3 shows how to go from audit to reporting.
Whatever the scope, data quality is an audit issue as much as a forecasting one. Our energy data governance checklist covers the path from meter to report.
Our perspective
We built EnerlyticsAI around a conviction that most UK businesses do not have a forecasting problem first. They have a data trust problem. Teams ask for a forecast when the bills they would forecast from include estimates, duplicated charges or meters on the wrong site. A confident prediction built on that history is just an expensive way to be wrong.
So we start where the money leaks: validate the bill, check the half-hourly profile, flag the anomaly. Only then does a forecast mean much. Once the history is clean, even modest methods work well, and the same data serves finance (budgets), facilities (peaks and baseload) and sustainability (Scope 1 and 2 numbers) without three separate spreadsheets.
We also think access should not depend on budget. A sustainability manager at a small manufacturer or a recycling operator should be able to see their sites in one place before anyone asks for a contract. That is why the core platform has a free forever plan.
— Chris
Getting started with EnerlyticsAI
If you want to forecast your own sites rather than read about it, the sequence is short. Connect your sites, bring in half-hourly data, check your bills against it, and use the predictive tools and emissions reporting once the history is clean. You can open a free forever account to manage multiple sites without upfront charges.
Paid plans are there when you outgrow the free tier. As published on our site: Eco is £49 per month, Growth is £79 per month, Professional is £149 per month and Scale is £299 per month.
FAQ
What is energy demand forecasting?
It is the prediction of how much energy will be needed at a future time, based on past consumption, weather, calendar effects and expected changes. Grid operators use it to run networks safely. Businesses use it to budget, manage peaks and project emissions.
What are the main types of energy load forecasting?
The common split is by time horizon: very short-term (seconds to minutes), short-term (hours to days), medium-term (days to months) and long-term (months to several years). Some sources draw the boundaries slightly differently. Most businesses work mainly with short-term and long-term views.
How do I forecast energy consumption for my business?
Start with at least a year of clean half-hourly data, flag one-off events and estimated reads, then build a baseline from the same period last year adjusted for weather and planned changes. Add regression or machine-learning models only once the baseline is reliable. Review forecast versus actual each month.
Do I need a smart meter to forecast energy demand?
It is not strictly required, but half-hourly data from smart or advanced meters makes forecasts much more useful than monthly totals. Without it you can still forecast from bills, though you will miss peaks and baseload patterns. Our guide on smart meter data access sets out the options.
Which method is the most accurate?
No single method wins everywhere. A 2025 academic review found that the best choice depends on the problem, the horizon and the data available. Clean data and a sensible baseline matter more than model complexity.
Sources
- NESO, Energy Forecasting Strategy & Delivery Plan
- Predictive models for short-term load forecasting in the UK (PLOS ONE)
- NESO, 7 Day Ahead Demand Forecast
- NESO, Forecasting Stakeholder Working Group
- Met Office, Balancing supply and demand
- NESO, Modelling Methods
- Review of Methods and Models for Forecasting Electricity (MDPI)
- Energy Managers Association, Managing an Energy Budget
- gov.uk, An introductory guide to smart meters for the public sector
- Carbon Trust, Conversion factors guide
- Carbon Trust, SECR explained