
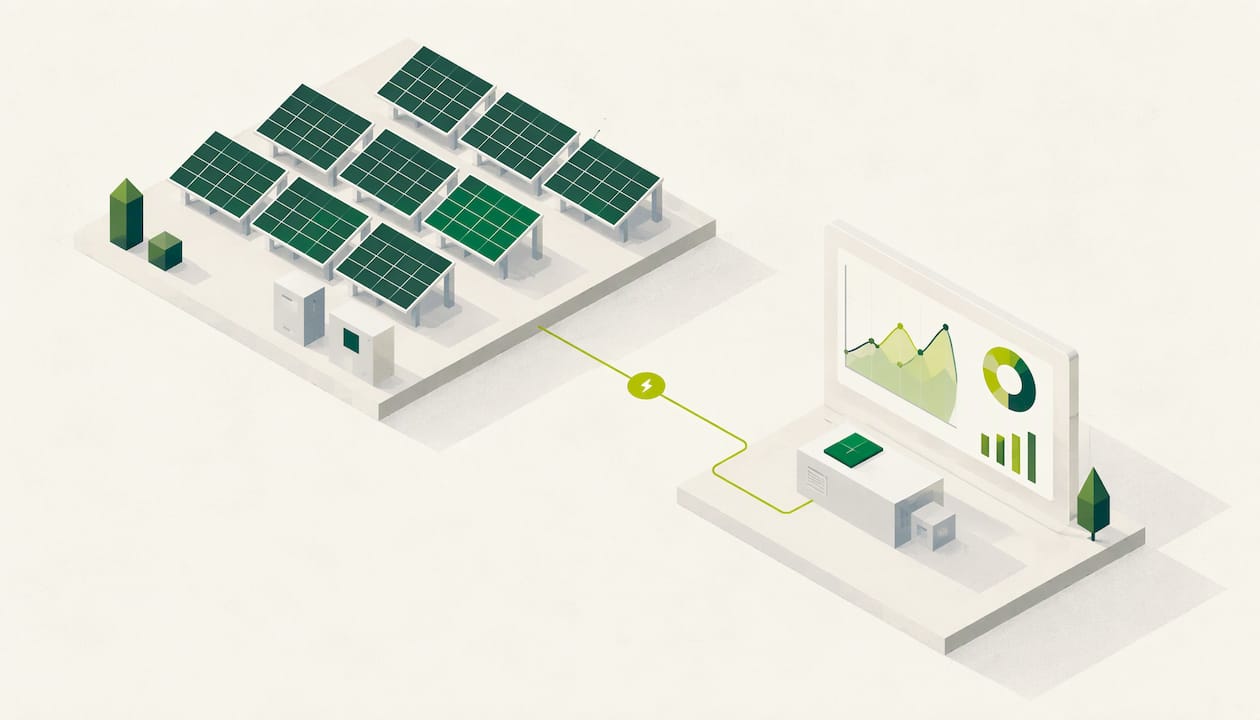
Onsite solar monitoring tracks how much power your array generates, how much of it your site uses and how much goes to the grid. It also raises an alert when something stops working. It only pays off when the generation data is read alongside your half-hourly import data and your bills. A panel that quietly underperforms costs you twice: lost generation and extra electricity bought from the grid. We built Enerlytics AI around half-hourly consumption data and bill checking, so this guide shows where solar monitoring ends and where the energy picture for your site begins.
TL;DR
- Monitoring measures generation at the inverter or meter, and may also cover export, onsite consumption, weather and equipment faults.
- Onsite consumption is generally generation minus export, so you need generation and export data to see what the array saves you.
- Compare actual yield with expected yield every day, and treat an unexplained gap as a fault to investigate.
- Across several sites, use the same measures, the same data checks and a named owner for every alert.
- Put generation data next to half-hourly consumption and billing data, and the savings and the problems both become visible.
Table of Contents
- What onsite solar monitoring measures
- The hardware and connectivity behind it
- Generation, export and onsite use: reading the three numbers
- Using monitoring to find faults early
- Monitoring across several sites
- Questions to settle in the monitoring and maintenance contract
- Connecting solar data to your bills and carbon reporting
- Where Enerlytics AI fits
- Our perspective
- FAQ
- Sources
What onsite solar monitoring measures
At its simplest, monitoring records the electricity your array produces. Welsh Government guidance describes a monitoring device as one typically installed at the inverter, measuring generated kWh, inverter power and system faults. The inverter is the box that converts the panels' direct current into the alternating current your building uses. The same guidance notes that monitoring may also cover electricity meters, weather data and SMS fault alerts.
Solar Energy UK's rooftop operations and maintenance manual goes further. It says monitoring continuously checks power and other performance characteristics, including the electricity generated and component temperature, so faults can be found and performance optimized. Depending on the design, a system can also record:
- export to the grid
- onsite consumption
- irradiance (the sunlight reaching the panels)
- module and ambient temperatures
- equipment status and fault codes
That list matters because each item answers a different question. Generation tells you whether the array works. Export and consumption tell you whether it is saving money. Irradiance and temperature tell you whether a low reading is a fault or just a grey day.
The hardware and connectivity behind it
The same Solar Energy UK manual lays out what a commercial design may include: inverter or string monitoring, generation and import/export meters, current transformers (clamps that measure current without cutting into the cable), irradiance and temperature sensors, a data logger or gateway, and optionally a weather station. Ethernet, Wi-Fi or cellular connections then feed a local display, a web portal or an app. These show live and historical generation, consumption, export, alarms and reports.

Two design points are worth knowing before you speak to an installer.
Level of detail. Monitoring can work at meter, inverter or string level, and it can be installed during construction or retrofitted later. Meter-level data is the minimum. Inverter and string data help you find which part of the array is at fault.
Half-hourly metering. The Welsh Government's 2026 contract note recommends a half-hourly meter at each generating station able to measure, record, store and transmit half-hourly data. It also says owners can monitor performance with a half-hourly generation meter alone, although operational platform data is useful. Half-hourly data is the same resolution your electricity supplier and settlement system use, which makes it the natural common language between your solar array and your bills. Our guide to half-hourly meter checks explains why that matters for billing accuracy.
Generation, export and onsite use: reading the three numbers
Most confusion in solar reporting comes from mixing up three figures. Generation is everything the array produces. Export is the part sent to the grid. Onsite consumption is the part your site uses directly. Generation minus export is generally how onsite consumption is calculated, although some systems measure it directly.
A worked example makes the point. These numbers are illustrative, not from a real site:
| Measure | Daily kWh | What it tells you |
|---|---|---|
| Generation | 1,000 | The array is working |
| Export | 300 | 300 kWh left the site |
| Onsite consumption (generation minus export) | 700 | 700 kWh of grid electricity was avoided |
| Total site demand | 1,500 | The site still needed 800 kWh from the grid |
The last row is the one generation monitoring cannot give you. Total demand comes from your import meter and half-hourly consumption data. Without it, you know the array produced 1,000 kWh but not whether that cut your grid bill by 10% or 50%.
Sites with high daytime loads, such as manufacturing lines, recycling plants or refrigeration, tend to use most of what they generate. A site that is quiet at weekends exports more, and export is usually valued differently from avoided imports. Matching the daily shape of generation against the daily shape of demand is where baseload and peak load analysis helps. Where a site pairs solar with electrified heating, solar and heat pump sizing also changes how much of the generation is used onsite.

Using monitoring to find faults early
The core routine is simple. Solar Energy UK says monitoring data can be compared with expected power yield to identify problems such as underperformance and soiling-related losses. In practice the routine looks like this:
- Set an expected yield. Use the design estimate adjusted for the weather that day, using irradiance data if you have it.
- Compare daily. Welsh Government guidance recommends regular daily and monthly checks, which can use an app, meter readings or spreadsheet analysis.
- Triage alarms. Look at inverter, string and meter alarms and at trends that suggest shading, soiling, component failure or lost communications.
- Send an engineer. The recommended response is alert, triage, engineer investigation and remedial action.
- Record the outcome. Note the cause, the downtime and the fix.
Speed matters because the loss compounds. The Welsh Government notes that prompt resolution reduces lost generation and expensive imported electricity. A site that spots a dead inverter on day one loses a day of output. A site that spots it on the next quarterly bill loses a quarter.
What to do when the connection drops
When internet or cloud access fails, the array normally keeps generating, but you lose visibility and alerts. Treat this as a design question to settle at commissioning. Ask whether the logger stores time-stamped readings locally and forwards them once the connection returns, so a short outage does not leave a permanent gap in your reports. Ask who gets notified when a gateway goes offline, and who owns the router and Wi-Fi credentials. A changed broadband provider or router is an easy way to silence monitoring without anyone noticing.
Monitoring across several sites
One array is a monitoring task. Ten sites is a data management task. The evidence points to a few habits.
Validate the data. Streams can be missing, erroneous or inconsistent between sites. PV-Tech's asset-management paper recommends validating monitoring data against independent weather datasets, documenting corrections and gaps, keeping alarm and event records, and bringing datasets together in one central store.
Separate the kinds of data. The Welsh Government's 2024 guidance splits data into fixed benchmark data, cyclical tariff and contractual data, and dynamic data such as live consumption, generation, export, faults and weather. It describes active management as cross-referencing all three to assess and improve the array. For a finance team, that means your tariff and contract data sit beside the generation figures, not in a separate file.
Report monthly. The Welsh Government says monthly portfolio reporting should let owners verify generation against expectations. It should also detail availability, planned and unplanned maintenance, and health-and-safety issues and near misses.
A useful monthly sheet per site has six lines: generation, export, onsite use, total import, availability and open faults. Our roadmap for UK multisite energy management covers how to roll that out across a portfolio, and the energy monitoring strategy guide shows how solar fits into a wider plan.
Questions to settle in the monitoring and maintenance contract
If a contractor monitors the array for you, the data and the response are part of what you buy. The Welsh Government warns that monitoring platforms may primarily serve contractors and says owners should secure suitable access. Its contract guidance also says the owner should:
- define who is responsible for monitoring flags and for the response
- retain historical performance data
- align maintenance terms with grid and power-purchase obligations
- record the causes of downtime in an operational diary
Write these into the contract in plain terms. "Monitored" on its own tells you nothing about who is alerted, how fast they respond or who can see the data. If you hold your own copy of the half-hourly generation and import data, you can check the contractor's reports against the numbers yourself.
Connecting solar data to your bills and carbon reporting
Solar monitoring answers whether the array works. Your energy platform should answer what that means for cost and carbon. Three links are worth making.
Bills. Generation reduces what you import, so your bill should fall in step. If half-hourly imports look right but the invoice does not, something is wrong with the charge, not the array. Checking half-hourly data analysis against invoices is how those errors surface.
Budgets. Solar output varies by season, so cost forecasts need half-hourly shapes, not annual averages. See our piece on half-hourly energy cost forecasts.
Carbon. Electricity you generate and use onsite reduces the grid electricity counted in your Scope 2 figures. Reliable onsite use data is therefore a reporting input as well as a cost input, and gaps in monitoring become gaps in your emissions accounts.
Where Enerlytics AI fits
We start where your solar monitor stops: the half-hourly picture of what each site consumes, what the bills say and what the carbon figures are. The platform provides automated bill validation, anomaly detection, half-hourly consumption analytics, and carbon reporting covering Scope 1, 2 and 3. You can manage several sites from one web interface.
The Starter plan is free forever and lets you manage multiple sites without upfront charges. When you need more, the paid plans are Eco at £49 per month, Growth at £79 per month, Professional at £149 per month and Scale at £299 per month. You can start on the free plan and bring in your first site's consumption data.
If an invoice looks wrong, bill validation is the place to begin.
Our perspective
Most businesses that install solar treat monitoring as a gadget on the inverter. We see it differently: generation data is half a story, and the other half is half-hourly consumption.
A dashboard that says the array produced 1,000 kWh is good news, but it does not tell a finance director what the electricity bill should be, or tell a sustainability manager what the Scope 2 figure should be. Only consumption data, matched to billing, does that.
That is why we focus on half-hourly data, bill validation and anomaly detection across every site, and why we offer a free plan that lets a business start with one meter and grow from there. Nobody should have to pay before they can see their own data.
Our advice is to get the generation meter right, keep your own copy of the data, and read it next to your import data every month.
Chris
FAQ
What is onsite solar monitoring?
It is the continuous measurement of an array's output, usually at the inverter or a generation meter. It can also cover export, onsite use, weather and fault alarms. The data goes through a logger and a network connection to a local display or a web portal.
Do I need a half-hourly meter on my solar array?
The Welsh Government's contract guidance recommends one at each generating station. It also says owners can monitor performance with a half-hourly generation meter alone. Half-hourly data matches the resolution of your supplier's data, so it is easy to compare against your consumption and bills.
How do I know how much solar power my site actually uses?
Subtract export from generation. For example, 1,000 kWh generated and 300 kWh exported means 700 kWh was used onsite. Some systems measure onsite use directly. Compare that with your total import data to see the share of demand the array covers.
What happens if my monitoring loses its internet connection?
The array normally keeps generating, but you stop seeing data and receiving alerts until the link returns. Ask your installer to confirm the logger stores readings locally and sends them on reconnection. Keep router and Wi-Fi details up to date after any provider change.
Sources
- Monitoring and maximising the performance of roof-top solar arrays: fact-finding (Welsh Government, 2024)
- Monitoring and maximising the performance of roof-top solar arrays: guidance (Welsh Government, 2023)
- Renewables: operation, monitoring and maintenance contracts (Welsh Government)
- Rooftop Operations and Maintenance Best Practice Manual 2.0 (Solar Energy UK)
- Proactive monitoring in effective PV asset management (PV-Tech)