
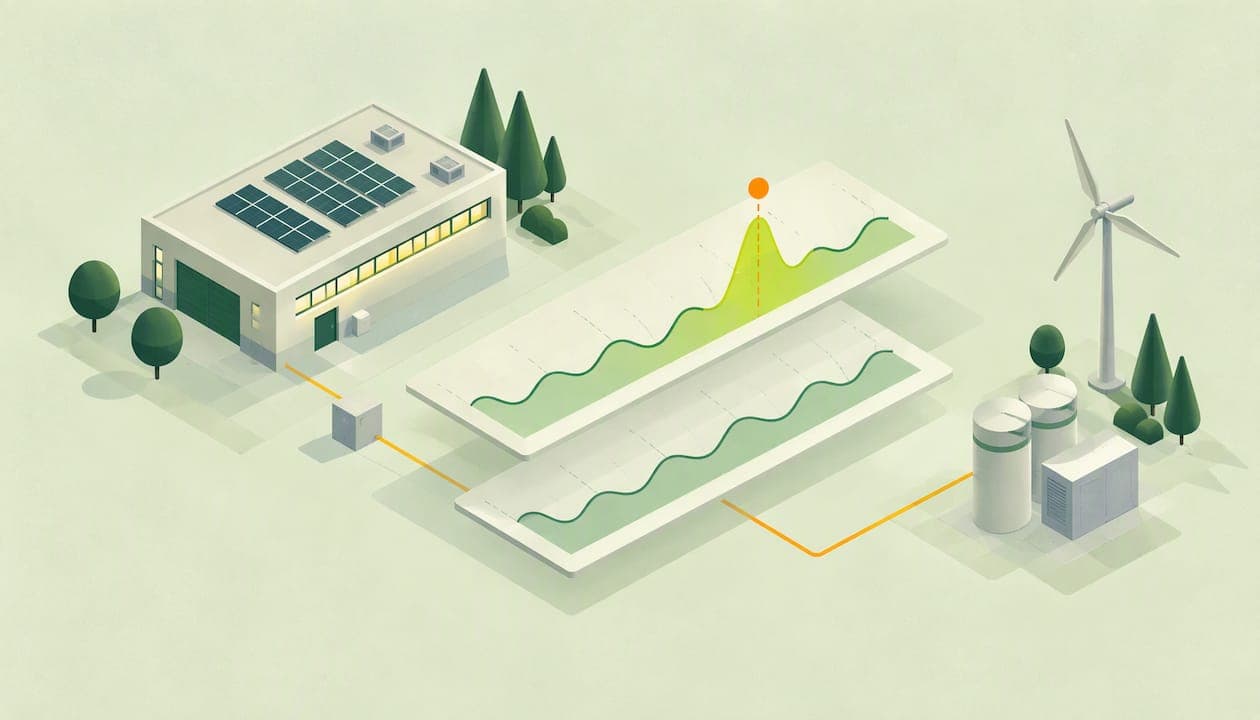
Energy anomaly detection is the automatic spotting of consumption or billing that departs from what a site normally does: a boiler running through the night, a meter that stops reporting, an invoice that does not match the data. It works by learning each site's usual pattern from metered data, ideally half-hourly, and flagging what falls outside it. For a UK business, the payoff is catching waste, equipment faults and billing errors in days rather than at the next annual review.
This guide explains what counts as an anomaly, what data you need, which methods sit behind the software, how to judge a tool, and how to connect the findings to cost cutting and Scope 1, 2 and 3 reporting.
TL;DR
- An energy anomaly is any reading, pattern or bill that breaks from the expected profile for a site, whether from a fault, waste, a data gap or a billing error.
- Half-hourly meter data is the best raw material, because it shows how demand moves through the day and makes out-of-range alerts possible.
- Judge software on data coverage, alert quality, bill checking, multi-site views and reporting, not on the sophistication of the algorithm alone.
- Each confirmed anomaly feeds three goals at once: lower cost, a cleaner emissions baseline and better evidence for net-zero plans.
- You can start with a free plan and add sites before paying anything.
Table of Contents
- What energy anomaly detection actually finds
- What data it needs
- How detection works: methods in plain words
- From alert to action: a worked example
- Perspective: why we think anomaly detection should start with the bill
- Turning anomalies into savings and carbon reporting
- How to choose energy anomaly detection software
- Getting started in five steps
- Try it on your own sites
- FAQ
- Sources
What energy anomaly detection actually finds
An anomaly is not simply a high reading. A factory should use more energy on a production day, so a high number alone means nothing. What matters is whether the reading is unusual for that site, at that time, under those conditions.
Research on buildings describes the causes broadly. A 2021 review of anomaly detection in building energy notes that abnormal behavior can arise from faulty device operation, occupant negligence, theft or non-technical losses, and that it can mean higher consumption, longer operating times or permanent device damage. A 2018 study on autoencoder-based methods adds sensing and transmission errors and energy-inefficient control strategies to the list.
In practice, UK facility and finance teams meet a handful of recurring patterns:
- Out-of-hours load. Lighting, compressors or heating running when the site is empty. Typically visible as a baseload that sits higher than it should overnight and at weekends.
- Equipment drift. A chiller, boiler or motor slowly using more energy for the same output, which a threshold alarm often misses because no single reading looks alarming.
- Sudden spikes. A short, sharp peak that may point to a control fault or a start-up sequence that has gone wrong.
- Missing or stuck data. A meter that stops reporting or repeats the same value. This matters because a gap can lead to an estimated bill. Our guide to spotting meter data gaps before bills are estimated covers that case in detail.
- Billing mismatches. Charges that do not reconcile with metered consumption, wrong rates or periods billed twice.
Researchers usually sort anomalies into point anomalies (one odd reading), contextual anomalies (normal in value but odd for the time or weather) and collective anomalies (a run of readings that is unusual together). The distinction explains why a fixed alarm limit is a blunt tool: a reading that is fine at 2 pm on a Tuesday can be a problem at 2 am on a Sunday.
The Carbon Trust's buyers' guide describes digital energy management technologies as tools that let organisations monitor consumption, detect avoidable waste and be notified of unexpected energy use. That three-part job, monitor, detect, notify, is a good working definition of what you are buying.
What data it needs
The quality of the detection is capped by the quality of the data. Three layers matter.
Metered consumption
Automated detection tracks consumption patterns from aggregate smart meter data and reports unusual events to building managers, as set out in the LEAD1.0 research paper. The same paper argues that smart meters are the most efficient sensing option for long-term sustainability because they scale, install easily and are simple to monitor.
For a UK business, the useful resolution is half-hourly. The Better Buildings Partnership's Better Metering Toolkit explains that half-hourly measurements let users understand how demand varies through the day and support out-of-range alarms that warn building management when corrective action may be needed. Daily or monthly totals hide almost everything an anomaly detector looks for.
Half-hourly data is also becoming the norm across the market. According to EDF's explanation of the reform, Ofgem's market-wide half-hourly settlement programme is moving the industry in phases between September 2025 and July 2027, extending half-hourly settlement to all electricity meter points, where it was previously required only for the largest consumers. If you are unsure how to get your own data, see our overview of smart meter data access options for UK businesses.
Context data
Research also points to occupancy patterns and ambient conditions as extra inputs that help a model tell a genuine fault from a busy day or a cold snap, per the 2021 review. For most businesses this means opening hours, production schedules and, where available, weather. You do not need all of it on day one. Opening hours alone remove a large share of false alarms.
Billing data
The Better Metering Toolkit also notes that automated reading lets you cross-check manual meter readings and utility bills to detect billing errors. That is why bill validation belongs in the same workflow as consumption analytics. A usage anomaly tells you something odd happened on site; a bill anomaly tells you the supplier's charge does not match what the meter says. Our guide to checking business energy bills for errors walks through the checks, and the one on half-hourly meter checks to avoid billing errors covers the metered side.
How detection works: methods in plain words
You do not need to choose the algorithm, but knowing the families helps you ask better questions of a supplier.
- Rule and threshold alerts. Simple and transparent: alert when load exceeds a set value. They are easy to set up and easy to explain, but they ignore context and tend to either flood you with alerts or miss slow drift.
- Statistical decomposition. The series is split into trend, daily and weekly seasonality and a remainder, and outliers are found in the remainder. The MODERATE platform's benchmarking workflow uses an MSTL decomposition followed by statistical outlier detection to prepare data for anomaly detection.
- Machine learning. The 2021 review lists clustering, one-class learning, dimensionality reduction and AI approaches such as autoencoders. These learn what normal looks like for each meter and flag deviations without needing a library of labelled faults.
- Pattern-based labelling. The LEAD1.0 authors describe annotating anomalies by looking for disturbances in daily or weekly patterns, or for days that differ strongly from neighboring days. It is how people reason about it too, which makes alerts easier to explain.
The same review is candid about open challenges: a shortage of annotated datasets, no unified assessment metrics, scalability and privacy. For a buyer, that translates into a practical rule. Ask how a tool learns each site's baseline, how you can mark an alert as expected or genuine, and how it copes with a new site that has little history.
From alert to action: a worked example
The numbers below are illustrative, not client results, and exist only to show the logic.
Imagine a small manufacturer with a baseload of 18 kW overnight. For weeks the baseload is steady. Then it drifts to 26 kW and stays there. No single half-hour breaches a threshold, and the monthly total moves only a few per cent because production also varied. A detector comparing each night with the site's own pattern flags a sustained step change on a particular date.
The team checks what changed that week. A compressor's auto-shutdown has been left on manual after maintenance. They reset it, and the overnight load returns to its usual level. An 8 kW excess running for roughly 10 hours a night comes to about 80 kWh a night, or around 29,000 kWh over a year, before counting the extra wear on the machine. At any given unit rate that is a real sum, and it was invisible in the monthly totals.
The pattern is the same in every case:
- Detect: the system flags the deviation and the time it began.
- Diagnose: someone matches the date to a maintenance log, a schedule change or a tariff change.
- Fix or confirm: repair, reschedule or mark the alert as expected so the model learns.
- Record: log the saving and the cause, because that record is evidence for budgets and reports.
The same logic applies to heat. Our article on boiler efficiency tracking with half-hourly data shows how a gradual loss of efficiency appears in the data well before a breakdown.
Perspective: why we think anomaly detection should start with the bill
Most tools begin with the meter and leave the invoice for later. We think that order is backwards for a business that wants results quickly. The bill is where money leaves the company, and it is where errors and estimated reads quietly cost the most. When bill validation and half-hourly analytics sit in one place, an unusual charge and an unusual load profile can be read side by side, and the finance officer and the facility manager are looking at the same facts.
We also believe the barrier for most UK organisations is not a lack of clever algorithms. It is the effort of getting several sites, several suppliers and several formats into one view. That is why EnerlyticsAI is built around multi-site management and a free forever plan: you should be able to see your own data and judge the value before anyone asks for a budget. Our approach is designed to make detection a routine, shared habit rather than a specialist project.
Finally, we treat every anomaly as a carbon data point as well as a cost point. A fault that wastes electricity also inflates your reported emissions, and fixing it improves both lines of the report.
— Chris
Turning anomalies into savings and carbon reporting
The research question of how detected anomalies support cost reduction and reporting has a simple answer: they improve the quality of the numbers every plan relies on.
Cost. Waste removed is energy not bought. Billing errors found are money recoverable, and our guide on recovering up to six years of refunds on business energy explains why historic data is worth keeping. Clean half-hourly data also improves budgeting, as in our piece on half-hourly energy cost forecasts.
Scope 1 and 2. Scope 1 covers direct emissions such as fuel burned on site or in company vehicles. Scope 2 covers purchased electricity, heat and cooling. Both are driven by metered energy, so a site with undetected waste reports higher emissions than it needs to, and an estimated bill makes the figure less reliable. Detection tightens the underlying activity data.
Scope 3. Value-chain emissions rely more on supplier and activity data than on your own meters, so anomaly detection helps indirectly: it gives you trustworthy energy figures to use as inputs, and frees time to work on the harder categories.
Net zero. A decarbonisation plan needs a credible baseline. Starting from a year of data with anomalies identified and explained means you set targets against how the site should run, not against how a fault made it run. For heat in particular, see how to build a heat decarbonisation plan without weeks of meter work.
Tools that combine monitoring with emissions reporting also help teams show progress to customers and stakeholders; the article on sustainable energy billing and customer trust looks at how energy monitoring and management tools support efficiency and lower emissions.

How to choose energy anomaly detection software
The Carbon Trust's buyers' guide observes that purchasers can find it hard to identify the right digital energy management system, and that users often lack the confidence to use all it offers. A short checklist keeps the decision grounded. The guide's basic tests are whether a system gathers and collates consumption data, reports or displays findings, and suits your needs.
Build on those with these criteria:
| Criterion | What to ask |
|---|---|
| Data coverage | Does it take half-hourly electricity and gas data, and can it handle sites with mixed meter types? |
| Alert quality | Does it learn each site's baseline, or only apply fixed thresholds? Can you mark alerts as expected? |
| Bill checking | Does it reconcile invoices against metered consumption and flag mismatches? |
| Multi-site view | Can you compare sites, group them and see which needs attention first? |
| Reporting | Does it produce emissions figures for Scope 1, 2 and 3 you can use in annual reports? |
| Ease of use | Can a finance or facilities colleague use it without training in data science? |
| Cost to start | Can you test on real sites before committing? |
Two more practical points. First, run any tool on your own data for a few weeks, because the proof is whether the first alerts are ones you can act on. Second, check how quickly you can add sites, since the value of comparison grows with each one. Our multi-site energy management roadmap lays out a data-first order of work, and the energy management KPIs guide suggests what to track once alerts are running.
Getting started in five steps
- List your sites and meters. Capture MPANs and MPRNs, the supplier and the contract end date for each site.
- Bring in data. Connect or upload half-hourly consumption and your latest bills.
- Add context. Enter opening hours and, if relevant, production schedules.
- Review the first alerts together. Have finance and facilities look at the biggest flags jointly. Mark expected ones so the system improves.
- Log outcomes. Record the cause and the saving for each confirmed anomaly and review monthly.
Try it on your own sites
EnerlyticsAI is a UK platform for bill validation, anomaly detection, half-hourly analytics and Scope 1, 2 and 3 carbon reporting across multiple sites. The Starter plan is free forever, so you can set up your sites and see what the data shows before paying. Paid plans are Eco at £49 per month, Growth at £79 per month, Professional at £149 per month and Scale at £299 per month, for teams that outgrow the free plan.
You can create a free account, or look at how the platform handles bill checking and emissions reporting first.
FAQ
What is the difference between energy anomaly detection and energy monitoring?
Monitoring shows you consumption; anomaly detection tells you which part of it is unusual and worth attention. Monitoring leaves you to scan charts yourself. Detection does the scanning and flags deviations from each site's expected pattern, so people spend time on causes rather than on searching.
Do I need smart meters to detect energy anomalies?
Smart or half-hourly meters give the best results, because they show how demand moves through the day. Research favours smart meters for their scalability and ease of installation. Without them you can still compare bills and manual reads, but short spikes and overnight waste are far harder to see.
Can anomaly detection find billing errors?
Yes, when bills are compared with metered consumption. Cross-checking readings and invoices is a recognised way to detect billing errors, and it works best alongside half-hourly data. Typical flags include estimated reads, wrong periods and charges that do not match usage.
What kinds of businesses benefit most?
Any organisation with several sites, a large baseload or a mix of meters benefits, since problems hide more easily across many locations. Manufacturers, recyclers, fleet operators and multi-site property teams often see the clearest gains, because equipment runs for long hours and faults are costly.
How long does it take to see useful alerts?
It depends on how much history you can load. With historic half-hourly data, a baseline can be established straight away. With a new meter, expect the model to need some weeks of data to separate normal variation from true anomalies.
Sources
- Anomaly detection of energy consumption in buildings: a review (2021)
- Analytical investigation of autoencoder-based methods for energy anomaly detection (2018)
- Digital technologies for energy management: a buyers' guide, Carbon Trust
- LEAD1.0: a large-scale annotated dataset for energy anomaly detection (2022)
- Better Metering Toolkit, Better Buildings Partnership
- Timeseries energy benchmarking, MODERATE platform
- Market-wide half-hourly settlement (MHHS) reform
- Building customers' trust with sustainable energy billing