
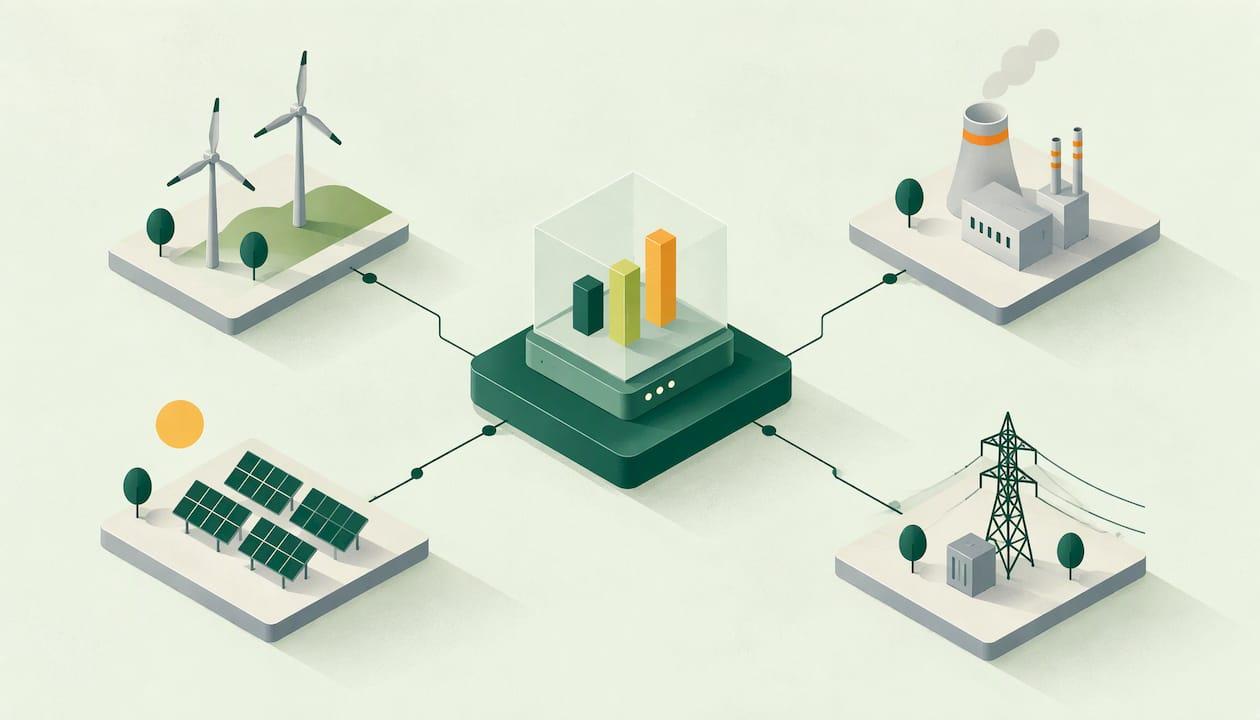
An energy data API lets software pull electricity, gas, market or carbon figures straight from the source, with no spreadsheets or manual downloads. In Great Britain, the free public options cover the grid: generation, demand, settlement data and carbon intensity. Your own meter and billing data sits behind permissions, and the route to it depends on your role and your contracts. This guide explains which APIs exist, what they return, who can use them, what limits apply, and how to turn the data into cost control and Scope 1, 2 and 3 reporting.
TL;DR
- Public GB APIs (Carbon Intensity, the NESO Data Portal, Elexon Insights) cover grid-level data: generation, demand, forecasts and carbon intensity. They do not show your site's consumption.
- Your own half-hourly data comes from smart or half-hourly meters. Access needs the right permissions, and for gas and industry-level enquiry services, a registered market role.
- Check rate limits, licence keys and expected request volumes before you build anything that depends on an API.
- Treat API readings as evidence, not gospel. Gaps, estimates and meter changes are normal, so validate them against bills.
- Most finance and sustainability teams get more value from a platform that validates bills and reports emissions than from building their own pipeline.
Table of Contents
- What energy data APIs actually give you
- Public UK energy data APIs worth knowing
- Getting your own half-hourly data: permissions first
- What access costs and which limits to check
- How reliable is API energy data?
- Connecting energy data to billing, building and fleet systems
- From API data to cost control and net zero
- Build your own pipeline or use a platform
- Check your bills and half-hourly data with EnerlyticsAI
- Our perspective
- FAQ
- Sources
What energy data APIs actually give you
The phrase covers four quite different kinds of data, and mixing them up is the most common reason a project stalls.
Grid and market data. Generation mix, national demand, forecasts, settlement and system information. It describes the whole system, not your meters. It is useful for timing flexible load, for context on wholesale conditions and for benchmarking.
Carbon data. Carbon intensity tells you how many grams of CO2 each kilowatt hour of grid electricity carries at a given time and place. It lets you model emissions at half-hourly resolution.
Meter and consumption data. Your own electricity and gas usage. Smart meters can store at least 13 months of half-hourly consumption data, and half-hourly is the most granular resolution they hold. This is the data that matters most for bill checking.
Tariff and billing data. Unit rates, standing charges and invoice lines. This usually arrives through supplier portals, files or bills rather than a public API, and it is the other half of any cost analysis. Our overview of what energy bills reveal about efficiency is a good primer on reading those lines.

Only when meter data and tariff data meet can you say whether a bill is right. Grid data on its own cannot do that.
Public UK energy data APIs worth knowing
These are the main official or primary sources for Great Britain. Each is aimed at a different job.
| Source | What it covers | Access notes |
|---|---|---|
| Carbon Intensity API | Forecast and estimated carbon intensity of GB electricity, regional data, postcode search | Currently free; a rate limit applies |
| NESO Data Portal | Datasets, resources and tabular data via CKAN endpoints (package search, resource search, datastore queries) | Public API; listed with other NESO applications and APIs |
| Elexon Insights | Demand, generation, forecasts and settlement-related datasets | REST APIs with no key required; CSV, XML or JSON responses |
| Ofgem Gas Enquiry Service | Machine-to-machine queries on gas-market data by MPRN, address, postcode or meter serial number | Authorised users only; subscription licence key |
| SSEN Flexible Power | Two-way API pattern for flexibility assets: schedules and start/stop signals out, metering data back | For participants in the scheme |
Carbon Intensity
The Carbon Intensity forecast covers emissions from electricity generation, including large metered generators, interconnector imports, transmission and distribution losses, national demand and embedded wind and solar. For a business, the practical use is simple: multiply half-hourly kWh by half-hourly intensity and you get a time-weighted emissions figure that is more informative than one annual factor.
NESO and Elexon
The NESO portal is built on CKAN, so the same few calls let you discover datasets and query tables. Elexon's portal is more market-focused, and the fact that it needs no API key makes it the easiest place to start experimenting. Both suit analysts who want context around their own consumption, such as demand peaks and generation conditions.
Ofgem and network operators
Ofgem's electricity data-access schedule says authorised users can receive electricity-enquiry data through web portals, APIs and reports, subject to the relevant data-access agreement. The gas equivalent limits access according to the user's market-participant role and registration at the relevant gas point. These are industry channels. A typical business does not call them directly, but a platform or agent working for you may sit behind them.
Getting your own half-hourly data: permissions first
Meter data is where most "api energy data" searches end up, and it is where the rules matter.
Business (non-domestic) sites. Ofgem's 2019 decision treated consumption data for non-microbusiness non-domestic sites as outside the domestic-style privacy controls, because it was not considered personal data. Microbusiness data stayed subject to additional controls. In practice, you should expect to give your supplier, meter operator or data agent written authority, and you should keep a record of who holds it.
Domestic-style smart meter rules. For homes, the framework is stricter: access to data more detailed than daily requires consent. Third parties using the DCC must obtain that consent, explain how the data will be used, describe opt-out rights and verify that the request came from the person occupying the premises. If your organisation manages homes, rented units or EV charging at residential addresses, this applies to you. A plain explanation of the smart meter rules around HHS and SMETS2 is worth reading before you design a consent flow.
Gas. The gas enquiry service restricts what each user can see by market role and appointment, so a business without that role will normally rely on its supplier, an agent or a data platform.
For a fuller walk-through of the routes open to a business, see our guide to smart meter data access for UK businesses.
What access costs and which limits to check
Public APIs are often free, but free does not mean unlimited. Before committing a system to one, check these points:
- Rate limits. The Carbon Intensity API is currently free, but NESO applies a rate limit and may block applications that make a large number of calls. Cache results and request only what you need.
- Keys and licences. The Ofgem gas service asks for expected usage volumes and a subscription licence key, and monthly request limits depend on the service plan. Others need no key at all.
- Data formats. Elexon returns CSV, XML or JSON, so confirm your tools can read the one you choose.
- Scope of terms. Terms of use for each source can change. Read the current terms on the provider's own page before building a commercial workflow.
- Continuity. A free public API can change its structure. Build so that one failed call does not break a monthly report.
How reliable is API energy data?
Treat any API feed as a measurement with known failure modes. Smart-meter communications drop out, meters are exchanged, registers are mapped incorrectly and accounts move between suppliers or occupiers. Each of these leaves gaps or estimated reads.
A sensible routine looks like this:
- Count the intervals. A full day has 48 half-hourly readings. Flag any day with fewer, and any run of identical values.
- Separate actual from estimated. Keep the read type next to each figure so analysts know what they are looking at.
- Reconcile against bills. Total the half-hourly data for the billing period and compare it with billed kWh. A mismatch is the start of a query, not a conclusion.
- Log meter events. Exchanges, re-registrations and site changes explain many breaks in a series.
- Keep the evidence trail. Where a bill is disputed, the API series supports your case but should sit beside the invoice, meter reads and correspondence.
We cover the practical side in spotting missing reads before bills are estimated and half-hourly meter checks.
Connecting energy data to billing, building and fleet systems
Once data flows, the question is where it lands. The patterns are straightforward even where the tools differ.
Billing and finance. Pull consumption per meter per period, join it to the tariff rates in force, and compute an expected charge. Compare that with the invoice line by line: unit rate, standing charge, capacity and network charges. Differences above a tolerance you set go to a review queue. Network cost lines such as DUoS charges are a common place for surprises.
Building management. Match half-hourly data to occupancy and equipment schedules. Baseload overnight and at weekends is the quickest indicator of equipment left running. The SSEN flexibility guide shows the two-way pattern: a system sends schedules and start/stop signals, then collects metering data back, with per-minute kW or half-hourly kWh readings. The same loop works internally, whatever the control system.
Fleet and EV charging. Treat each charger or depot meter as a site. Separate its half-hourly load from the building's so you can attribute cost and emissions to vehicles, and so charging can be timed for lower-carbon periods using carbon intensity data.
Analytics. Store raw readings unchanged, add cleaned and validated tables on top, and keep a mapping of meter identifiers to sites, cost centres and owners. Most reporting problems later trace back to a weak site-to-meter mapping, so invest there first. Our energy data governance checklist sets out what an audit-ready trail looks like.

From API data to cost control and net zero
Tracking cost across sites
With half-hourly data per site you can rank sites by cost per unit of output, spot those with high baseload and compare similar buildings. Choose a few indicators and track them monthly. Our list of energy management KPIs is a starting set. Add half-hourly analysis and anomaly detection and unusual usage surfaces without anyone scanning charts.
Reporting Scope 1, 2 and 3
The three scopes draw on different data:
- Scope 1: direct emissions, such as gas burned on site and fuel used in company vehicles. Gas meter data and fleet fuel records feed this.
- Scope 2: purchased electricity. Half-hourly consumption multiplied by a grid carbon factor, whether an annual factor or time-based intensity from the Carbon Intensity API, gives the figure. Record which method you used so year-on-year comparisons stay fair.
- Scope 3: value-chain emissions. Energy APIs help only in part here, for example with leased assets or purchased goods where suppliers share data. Expect to combine energy data with procurement and travel records.
For net-zero planning toward 2030 targets, the discipline matters more than the sophistication: one meter register, one method per scope, documented assumptions, and a figure you can trace back to a reading.
Build your own pipeline or use a platform
Building in-house suits teams with developers, a mix of unusual systems and a need to control every step. The costs are less visible: maintaining connectors, handling gaps, tracking API changes and producing audit evidence each year.
A platform suits teams that want answers rather than plumbing: bills checked, anomalies flagged, half-hourly patterns visible and carbon reported. Many organisations run a hybrid, using public APIs for context and a platform for their own meters and invoices.
Check your bills and half-hourly data with EnerlyticsAI
EnerlyticsAI is built for UK businesses that need accurate energy billing and credible carbon figures. It handles automated bill validation and anomaly detection, half-hourly consumption analytics, and carbon reporting across Scope 1, 2 and 3, with multi-site management in a web interface designed to be easy to use.
The Starter plan is free forever, so you can start with your sites without an upfront charge. Paid plans are Eco at £49 per month, Growth at £79 per month, Professional at £149 per month and Scale at £299 per month. Create your free account to get started.
Our perspective
Most teams that ask us about energy data APIs are really asking a different question: can I trust my bills, and can I prove my emissions? An API is a pipe. What matters is what you do once the data arrives.
We built EnerlyticsAI around that view. The valuable work is validating each bill against the half-hourly consumption behind it, catching anomalies early, and keeping carbon reporting consistent across Scope 1, 2 and 3. That is where money is recovered and where audit questions get answered.
We also think access should not be a barrier. A free forever Starter plan lets a business bring its sites in and see value before it pays anything. For many UK organisations, that beats months of integration work for a first result.
Use public APIs for context, such as grid carbon intensity. Use a platform for the data that is yours.
Chris
FAQ
Can I get my business's half-hourly data through an API?
Often yes, through your supplier, meter operator or a data platform acting with your authority. Smart meters hold at least 13 months of half-hourly data, and non-domestic consumption outside the microbusiness category was treated by Ofgem as not personal data. Ask your supplier which route it supports and what authority it needs from you.
Is there a free API for UK carbon intensity?
Yes. The Carbon Intensity API provides forecast and estimated carbon intensity for Great Britain, with regional and postcode data. It is currently free, but a rate limit applies, so cache results rather than calling it constantly.
Do I need an API key for UK energy market data?
It depends on the source. Elexon Insights needs no key, while the Ofgem gas enquiry service requires a subscription licence key and an authorised role. Check the provider's own page for the current rules.
How do I use energy API data for Scope 2 reporting?
Multiply your half-hourly electricity consumption by a grid carbon factor for the same period. You can use an annual factor or time-based carbon intensity, but record the method and apply it consistently from year to year.
Sources
- Smart Metering Implementation Programme: review of the data access and privacy framework (GOV.UK)
- Carbon Intensity
- Carbon Intensity API terms
- NESO API guidance
- NESO applications, portals and APIs
- Elexon Insights API Developer Portal
- Ofgem GES Service Definition
- Ofgem electricity data access schedule
- Ofgem response on access to half-hourly electricity data
- SSEN Flexible Power user guide
- Energy bills explained
- Smart meter EV charging, SMETS2 and HHS