
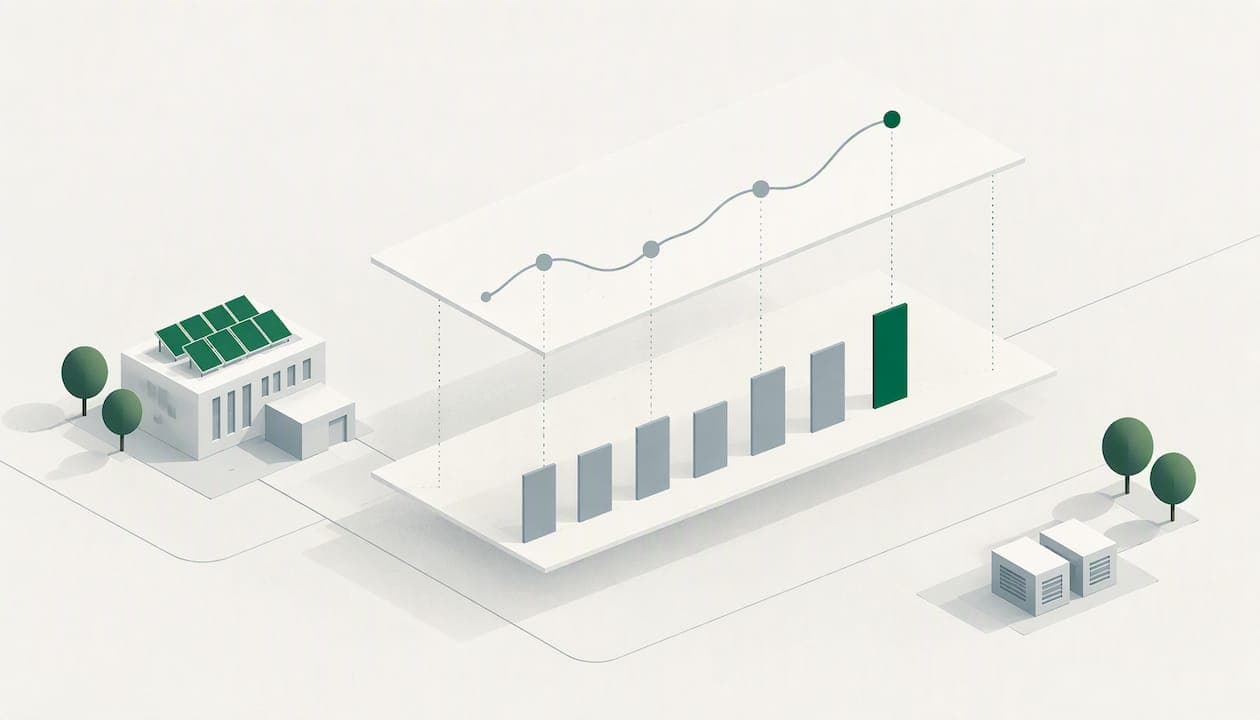
An energy baseline is the reference you measure every later change against, and the method you pick depends on what drives your consumption. If demand stays flat whatever the weather or output, a simple average of at least 12 months of data is enough. If it moves with temperature, production or occupancy, you need to normalize for those drivers, usually with an intensity ratio or a regression model. This guide shows how each method works, when to use it and how to keep the baseline defensible.
TL;DR
- An energy baseline is the quantitative reference used to judge whether energy performance has improved. It sits behind your energy performance indicators (EnPIs).
- Use at least 12 months of continuous data, and 24 where the data is clean. The period should reflect normal operating conditions.
- Simple averages suit sites with no external driver. Intensity ratios suit comparisons across sizes or output. Regression suits sites driven by weather, daylight, occupancy or production.
- Test which variables matter before you build a model, document the data sources and coefficients, and recalculate when the business structure changes.
- Once the baseline exists, track actual against expected consumption with CUSUM to see when savings or faults began.
Table of Contents
- What an energy baseline is and how it relates to EnPIs
- Choose the reference period first
- Method 1: Simple average or year-on-year comparison
- Method 2: Intensity ratios
- Method 3: Regression models
- Which method suits which operation
- Adjusting for weather, production and operating hours
- Keep the baseline honest: when to recalculate
- Using the baseline to measure savings and catch faults
- Our perspective
- Start your baseline on validated data
- FAQ
- Sources
What an energy baseline is and how it relates to EnPIs
An energy baseline is the quantitative reference used to compare current EnPI values and decide whether energy performance has improved. An EnPI is the metric itself. According to the US Department of Energy's 50001 Ready guidance, EnPIs are measured values, ratios or models accepted as meaningful representations of energy performance.
The two always work as a pair. The EnPI tells you how you perform now. The baseline tells you what "normal" looked like before you changed anything. In ISO 50001 terms, EnPI values and energy baselines (EnBs) together help establish and quantify improvements, as BS ISO 50005:2022 sets out. The technical framework for evaluating improvement by maintaining EnPIs and their matching EnBs is covered by BS ISO 50006:2023.
A practical way to think about it: the EnPI might be kWh per tonne of product, and the baseline is the equation or reference value that says how many kWh per tonne you used during your chosen reference period. If you are building an ISO 50001 programme from scratch, our five-phase guide to ISO 50001 implementation shows where baselining fits in the sequence.

Choose the reference period first
The method matters less than the data underneath it. Get the period wrong and even a good model describes a year that never represented your business.
Length. UK businesses are generally advised to use at least 12 months of continuous historical data, and 24 months where the data is clean, according to Energy Academy UK's monitoring and targeting course. The US-based ASHE guidance also starts from 12 months of monthly utility data and prefers 36 months for a building baseline. Twelve months captures a full seasonal cycle. Longer periods let you see whether one unusual year distorted the picture.

Representativeness. The period should reflect normal operating conditions. A year with a plant shutdown, a long refit, a site closed for months or a one-off production surge will skew every comparison you make afterwards. If you must use such a year, flag the abnormal weeks and exclude or adjust them, and write down why.
Base year for carbon reporting. If the baseline also feeds emissions reporting, Defra's Environmental Reporting Guidelines (March 2019) recommend choosing the earliest year for which reliable data exists. They also note that a single base year, or an average across a range of years, can smooth out fluctuations.
Resolution. Monthly bills are enough to start. Half-hourly data is far better where you have it, because it shows base load, start-up peaks and out-of-hours waste that monthly totals hide. Gaps matter here: before you fit anything, check for missing reads. Our guide to spotting UK meter data gaps covers how estimated reads creep into a dataset.
Method 1: Simple average or year-on-year comparison
The simplest baseline is the average consumption over your reference period, or the same month compared year over year. ASHE describes the approach as gathering at least 12 months of monthly data, analyzing trends and seasonal fluctuations, and comparing like months across years.
The UK government's guidance on checking baseline accuracy (Appendix B) says average demand readings suit sites where consumption is not driven by an external factor.
Works well for:
- Sites with steady, process-led or 24/7 loads that barely respond to weather
- Out-of-hours base load (the average overnight demand is a clean baseline for waste)
- A first-pass baseline when you have only a few months of data
Falls short when: weather, output or occupancy change the load. A cold winter followed by a mild one will look like a big saving even though nothing changed in how you operate. That is exactly the problem normalization solves.
Method 2: Intensity ratios
Normalization means adjusting data so you can compare like with like. The most common route is an intensity ratio: kWh per square meter for buildings, or kWh per unit of output for manufacturing processes. ASHE notes that square footage and operating hours are useful when comparing buildings of different sizes and usage types.
Ratios are quick to calculate and easy to explain to a finance director. They suit:
- Multi-site estates of different sizes (kWh/m² per site)
- Production sites where energy scales roughly in line with output (kWh per unit)
- Fleets or depots where a simple activity measure, such as vehicles or operating hours, explains most of the use
Two cautions. First, a ratio assumes energy scales in direct proportion to the denominator, and most sites have a fixed component that does not. A factory running at 60% output still heats and lights the building. Second, if your denominator is financial, Defra recommends volume-based measures adjusted for price changes so the indicator stays meaningful over time. Turnover that rises with inflation will make intensity look like it is falling when it is not.
For diversified organizations, Defra also suggests separate activity ratios for different parts of the business, such as travel services versus hotel operations in its own example. A recycling operation with a sorting line and a transport yard should do the same: one ratio per activity, not one blended figure.
Method 3: Regression models
When consumption responds to more than one thing, regression is the standard answer. It relates energy demand to independent variables such as external temperature, daylight minutes or building occupancy, as the UK government appendix explains. The same source notes that simple spreadsheet software can determine the fixed and variable components, the intercept and slope in a linear model.
A worked example
This is a hypothetical illustration, not client data. Suppose a small warehouse uses weekly gas and you plot it against heating degree days (a measure of how cold the week was). A fitted line gives:
Expected weekly kWh = 1,200 + (35 × heating degree days)
The 1,200 kWh is the fixed part: hot water, process heat, pilot loads. The 35 is the variable part: extra kWh for each degree day. In a week with 80 degree days, expected use is 1,200 + 2,800 = 4,000 kWh. If the meter shows 4,600 kWh, you used 600 kWh more than the baseline predicts for that weather. That gap is the number worth investigating, and it is invisible if you simply compare against last January.
Test before you model
BS ISO 50005:2022 recommends preliminary analysis, such as correlation scatter diagrams, to find which variables significantly affect consumption before you establish an EnPI model. In practice:
- Plot consumption against each candidate driver (temperature, output, operating hours, occupancy).
- Keep only the drivers that show a clear relationship.
- Fit the model on your reference period.
- Check how well it predicts the periods it was built from, using the checks in the government appendix.
- Record the data sources, drivers and fitted coefficients.
That last step is not paperwork for its own sake. Energy Academy UK stresses that a baseline should be documented well enough to be defensible and reconstructed by future teams. Our audit-ready energy data governance checklist goes through what an auditor expects to see from meter to report.
Which method suits which operation
| Method | Best for | Data needed | Main risk |
|---|---|---|---|
| Simple average or year-on-year | Steady loads, base load, early baselines | 12+ months of readings | Weather or output changes look like savings |
| Intensity ratio | Different-sized sites, output-led processes | Consumption plus floor area, units or hours | Ignores fixed load; poor denominators mislead |
| Single-variable regression | Heating or cooling dominated sites | Consumption plus degree days or output | Misses secondary drivers |
| Multi-variable regression | Manufacturing, mixed-use sites | Consumption plus several drivers, ideally half-hourly | Needs clean data and documentation |
A sensible rule: start with the simplest method that passes an accuracy check, and move up only when it fails. A model with five variables that nobody can explain is a weaker baseline than a ratio the whole team understands.
Adjusting for weather, production and operating hours
Weather normalization helps show whether a rise or fall in use came from the weather rather than from your actions, as ASHE puts it. For UK sites, that normally means heating and cooling degree days. Production normalization uses units, tonnes or machine hours. Occupancy and operating hours do the same for offices, schools and retail.
Some practical points:
- Use the driver data at the same interval as your consumption data. Weekly degree days against monthly bills blur the relationship.
- Only include a driver if it actually correlates. Adding variables to a model does not make it more accurate.
- Keep separate baselines for separate meters where uses differ, such as a boiler circuit and a compressed air system. Our guides to boiler efficiency tracking with half-hourly data and heat pump performance monitoring show how to isolate those loads.
The same logic applies outside electricity and gas. Property teams that benchmark other utilities face the same normalization questions, as in this guide to benchmarking water usage across buildings.
Keep the baseline honest: when to recalculate
A baseline is not permanent. Defra advises that a base year may need recalculation after significant structural changes such as mergers, acquisitions or divestments, or when the accuracy of data measurement improves significantly. For energy baselines under ISO 50001 the same thinking applies: if you add a production line, close a building or install sub-metering that reveals what was previously estimated, the old reference no longer describes your operation.
Good practice is to log each baseline change with the date, the reason and the effect on the numbers. Never adjust a baseline silently to make results look better. It also helps to build in a periodic review, for example annually, so drift is caught early rather than at audit time.
Using the baseline to measure savings and catch faults
A baseline earns its keep when you compare it with reality every period. CUSUM (cumulative sum of differences) is the standard tool: you add up actual minus expected consumption over time. Energy Academy UK explains that it shows the timing and size of savings, or the start of creeping faults. A CUSUM line trending downward means you are consistently beating the baseline. A line that turns upward shows when something began to waste energy, often weeks before a bill makes it obvious.
For multi-site organizations, the sequence is:
- Build a baseline per site, and per major meter where possible.
- Use the same method and reference logic across sites so results are comparable.
- Roll site results up into cost and emissions views for finance and sustainability reporting.
- Track the indicators that matter most. Our list of ten energy management KPIs is a good starting set.
Baselines also support carbon work. If your net-zero targets rely on proving reductions, the baseline is the evidence behind them. See how half-hourly data can validate science-based targets and how to structure Scope 3 tracking alongside it. For the wider plan, our energy monitoring strategy article shows how baselines connect to metering and reporting.
Our perspective
Most baselines we see fail for a dull reason: the bills feeding them were never checked. If a billed quantity is estimated, duplicated or wrongly charged, the baseline inherits the error and every saving you claim afterwards is built on it.
That is why we think baselining starts with validated data. Check the bills against the meter reads, find anomalies, and only then fit a model. Half-hourly data makes the model sharper, because you can see base load, peaks and out-of-hours use directly rather than inferring them from monthly totals.
We built EnerlyticsAI around that order of work: automated bill validation and anomaly detection, half-hourly consumption analytics, and carbon reporting across Scope 1, 2 and 3, all across multiple sites in one place. Our aim is that a sustainability manager, a finance officer and a facilities lead can look at the same numbers and trust them.
Start simple, document everything, and refine the method only when the data demands it.
Chris
Start your baseline on validated data
If you want to put this into practice, our free forever Starter plan lets you begin managing multiple sites without upfront charges. You can create a free account, then review your bills and your half-hourly data before deciding on a method.
Paid plans start at £49 per month (Eco), then £79 (Growth), £149 (Professional) and £299 (Scale), for teams whose multi-site needs outgrow the free plan. Check the site for what each plan includes. For billing-side checks that protect your baseline, read about avoiding half-hourly meter billing errors.
FAQ
How do I calculate an energy baseline?
Gather at least 12 months of consistent consumption data, ideally half-hourly or at least monthly. Check which drivers affect it, then either average it, divide it by a driver to get an intensity ratio, or fit a regression. Record the data sources and any coefficients.
What is an EnPI in ISO 50001?
It is the measure or unit of energy performance that your organization defines. It can be a value, a ratio or a model. You compare current EnPI values with the energy baseline to quantify improvement.
How much data do I need?
At least 12 months of continuous data, and 24 months if the data is clean. The period should represent normal operations, so exclude or flag abnormal events such as long shutdowns.
When should I recalculate a baseline?
When the business changes structurally, for example through mergers, acquisitions, divestments or a new production line. Also recalculate when measurement improves significantly, such as adding sub-metering that replaces estimates.
Sources
- 50001 Ready, Task 11: Energy Performance Indicators and Baselines
- Establish a baseline for current energy consumption (ASHE)
- Appendix B: Checking the accuracy of your baseline(s)
- Establishing Your Baseline, Monitoring & Targeting (Energy Academy UK)
- Environmental Reporting Guidelines, March 2019 (Defra)
- BS ISO 50005:2022
- BS ISO 50006:2023
- Water Usage Benchmarking: A Property Manager's Playbook