
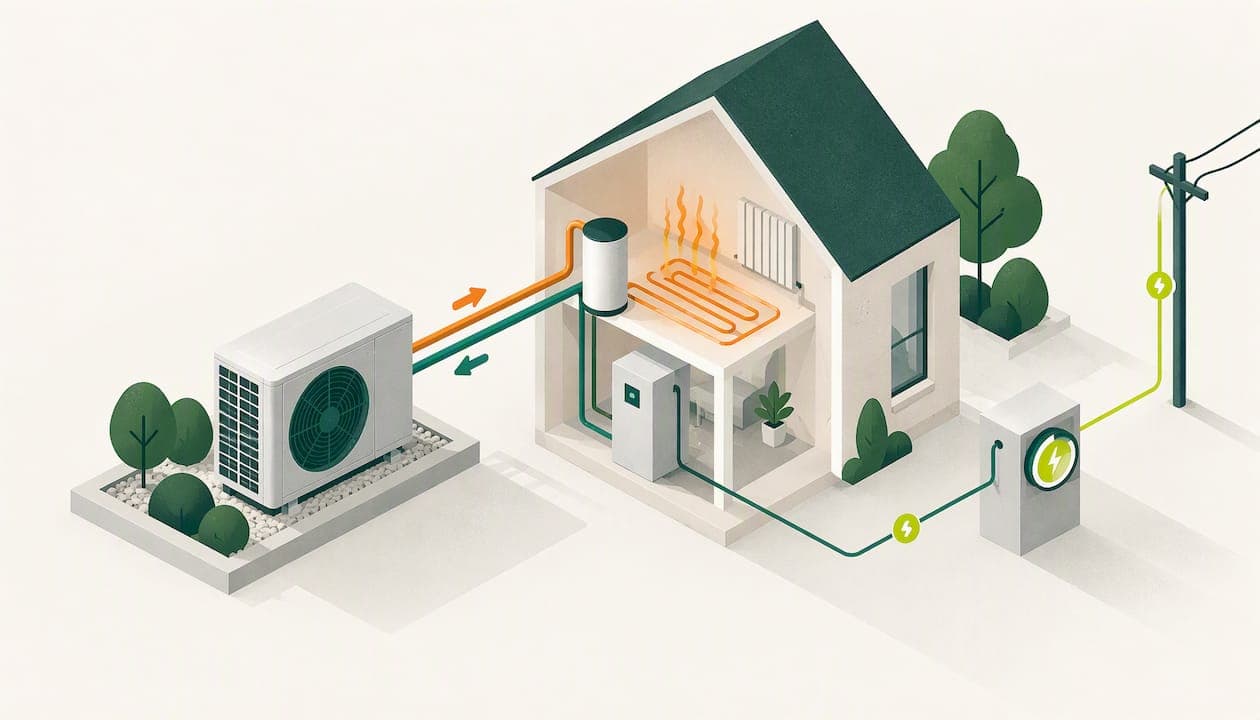
To monitor a heat pump properly you need two numbers measured over the same period: the electricity the system uses and the heat it delivers. Divide the second by the first and you have its seasonal performance factor (SPF). Everything else, from heating curves to tariffs to half-hourly load profiles, is about understanding why that number is good or bad and what to change.
This guide covers the metrics, the hardware, the settings that most often hold performance back and what UK field data says a realistic result looks like. It is written for people who run heat pumps across business, public-sector or residential portfolios: facility managers, sustainability leads, finance teams and consultants. Homeowners with a single unit will find the maths just as useful.
TL;DR
- SPF (heat out divided by electricity in, over a season) is the figure that matters. COP is a spot reading and SCoP is a modelled estimate.
- Accurate monitoring needs a heat meter, an electricity meter and a clear system boundary. Clip-on current sensors alone can mislead.
- UK field data shows wide spread: many air-source units sit well below 3.0, so a fleet average hides the poor performers.
- Heating curves, flow temperatures and tariffs are the first levers to check once data is flowing.
- The electricity side of the equation is where half-hourly data, bill validation and anomaly detection help most. We cover that below.
Table of Contents
- The metrics: COP, SCoP and SPF
- What UK field data says about real performance
- What you need to measure
- Reading the data: what good and bad look like
- The settings that most often hold performance back
- Tariffs: the other half of running cost
- Why this matters for multi-site portfolios
- Where we fit: the electricity side of the equation
- Our perspective
- A practical monitoring plan for your first 90 days
- FAQ
- Sources
The metrics: COP, SCoP and SPF
Three acronyms get mixed up constantly, and mixing them up produces misleading reports.
| Metric | What it is | Where the number comes from |
|---|---|---|
| COP | Heat output divided by electrical input at one moment | Manufacturer test or a live reading |
| SCoP | A theoretical seasonal efficiency under standard conditions | Calculation or product rating |
| SPF | Heat delivered divided by electricity used over a year in a real installation | Metered data from your site |
The Energy Saving Trust's domestic heat pump best practice guide draws the same line: SPF measures efficiency in a real, site-specific installation over a year, while SCoP is a theoretical figure in standard conditions. If you want to see how SCoP is presented on a product sheet, this Polish-language explainer on reading SCOP before you buy a heat pump walks through it from the buyer's side.
The system boundary decides the answer
The same guide notes that performance figures depend on the SEPEMO system boundary you choose. Does the electricity figure include the backup or immersion heater? The circulation pump? Source-side energy such as a ground loop pump or fan? Each choice shifts the result. Before you compare one site with another, write down the boundary and keep it identical everywhere. A report that quietly includes the immersion heater on one site and leaves it out on another is not a comparison.
Is a COP of 3.5 good?
It is a respectable seasonal figure, and a useful benchmark. Eligibility for innovative software projects in the UK government's Heat Pump Ready Programme requires evidence of an SPF of at least 3.5, gathered from at least 12 months of in-situ data. Note the wording: seasonal, measured, in a real home. A COP of 3.5 on a mild afternoon says little. An SPF of 3.5 across a winter says a lot.
What UK field data says about real performance
The most useful single reference is the analysis of Ofgem metering data from Renewable Heat Incentive installations, published as In-Situ Heat Pump Performance. Its headline points:
- Average ground-source SPF improved to 3.31.
- Many air-source units performed poorly, with more units sitting between SPF 2.0 and 2.5 than between 3.0 and 3.5.
- Around 33% of ground-source and 8% of air-source units reached SPF 3.5 or above.
- Roughly 67% of ground-source units and nearly 30% of air-source units reached SPF 3.0 or above.
- Only about 16% of ground-source and 6% of air-source units met or beat their design SCoP.
The lesson for a portfolio owner is that the design figure is a hope, not a result. The spread between units of the same type is large, which is exactly why you monitor each one rather than assume.
A second dataset points the same way. In a project report on ambient loop heat networks, Guru's smart heat pump case study found SPF values ranging from 1.0 to 6.0 across connected units. Over three winter months in 2024-25, 16 to 17% of heat pumps across three blocks sat in the red category, below SPF 2.5. The authors' conclusion is the one we would draw too: site-specific problems only surface with ongoing, unit-level data.
What you need to measure
The core measurement set is short.
- Electricity consumed by the heat pump, ideally on its own sub-meter or dedicated circuit.
- Electricity consumed by any backup or immersion heater, measured separately so you can include or exclude it deliberately.
- Flow temperature leaving the heat pump.
- Return temperature coming back.
- Flow rate through the circuit.
- Outdoor temperature, to explain seasonal swings.
Items 3 to 5 give you heat output. The Energy Saving Trust's walkthrough, as summarised in the search results for this topic, describes a heat meter as a set of sensors for delivered temperature, return temperature and flow rate. Multiply the temperature difference by flow rate and the specific heat of water, integrate over time, and you have kWh of heat.
Hardware tiers
The open-source OpenEnergyMonitor heat pump documentation lays out configurations from basic to advanced. The emonTx4 heat pump monitor guide lists what that setup measures: heat pump consumption, immersion and backup heater consumption, flow temperature, return temperature and other temperatures.
The same guide carries a warning worth taking seriously. Clipping current transformers around cables is a common entry-level method, but without a dedicated voltage sensor, power factor can cause large errors. The example given is a reading of 270 W of standby power where real active consumption was only 12 W. For business or fleet applications, the guide points to MID-approved electricity meters and class-2 heat meters as the route to high accuracy.
A practical way to choose:
| Situation | Sensible approach |
|---|---|
| One-off check on a single unit | Clip-on sensors and temperature probes, accepting some error |
| Compliance, funding evidence or warranty dispute | MID-approved electricity meter plus class-2 heat meter |
| Portfolio of many sites | Metered electricity at every site, heat meters where the stakes justify them, one consistent boundary |
Reading the data: what good and bad look like
Once you have a few weeks of readings, look for patterns rather than single numbers.
Flow temperature
Lower is better. Every degree you shave from the flow temperature lets the compressor work less hard. If your flow temperature sits high on mild days, the heating curve is probably set too aggressively.
Cycling
A unit that switches on and off repeatedly in short bursts is usually oversized, badly controlled or fighting a poorly set thermostat. In half-hourly electricity data this shows up as a jagged profile instead of long, steady runs.
Backup heater use
Any meaningful backup or immersion consumption in mild weather deserves an explanation. It drags SPF down fast because it converts one unit of electricity into one unit of heat.
Hot water
Domestic hot water runs at higher temperatures than space heating, so a site with heavy hot water demand will show a lower blended SPF. Separate the two if you can.
The settings that most often hold performance back
The Energy Saving Trust's guidance on running a heat pump efficiently stresses that heating curves, also called weather compensation, are a critical and frequently misconfigured setting. Installers often set them higher than necessary so that the coldest week is comfortable. Lowering the curve in small steps through the winter can bring flow temperatures down, raise efficiency and cut running costs without making the building colder.
The method is simple and monitoring makes it safe:
- Record a baseline fortnight of SPF, flow temperature and room temperatures.
- Lower the curve by one small step.
- Wait at least a week, long enough to see a cold spell and a mild one.
- Check that indoor temperatures held. If they did, compare SPF and repeat.
- If a space becomes uncomfortable, step back up and note the outdoor temperature at which it happened.
Without monitoring, that process is guesswork. With it, you can prove each step helped. If you also want a broader look at how controls, glazing and insulation interact with heating systems, this Spanish-language article on insulation, windows and heat pumps covers the building-fabric side.
There is one caveat on cold extremes. The same guidance notes that heat pumps can perform down to -15°C or lower, but there may come a point when output is not enough, and a boost or comfort setting is meant for those days. Use it deliberately, then switch back, because leaving it on quietly erodes your seasonal figure.
Tariffs: the other half of running cost
Efficiency is only part of the bill. The Energy Saving Trust's report on low-carbon technology combinations finds that the largest bill reductions, up to 80% against standard gas heating, come when heat pumps are paired with smart time-of-use tariffs and with technologies such as solar and battery storage. On standard flat-rate tariffs, a heat pump can cost the same or more to run than an efficient gas boiler.
The Trust's later piece on making renewable technology more affordable adds the other side: a good tariff is essential, but even the best tariff cannot fully protect against a badly performing heat pump. So you need both. Monitoring tells you if the machine is efficient. Half-hourly consumption data tells you when it draws power and what that costs.
Why this matters for multi-site portfolios
If you manage a single house, monitoring is a hobby. If you manage twenty schools, a housing association's blocks, a chain of depots or a set of care homes, it is risk management.
- Funding and evidence. Programmes want measured SPF over at least a year, as the Heat Pump Ready Programme criteria above show.
- Heat networks. The draft HNTAS technical specification sets out performance monitoring requirements for existing heat networks. It is a draft, so check the final text, but facility managers and consultants should align their metering strategy with it now. Efficiency calculations such as SPF are likely to be needed for both dwelling-level heat pumps and central energy hubs.
- Carbon reporting. Electrified heat moves emissions from Scope 1 (gas on site) to Scope 2 (grid electricity). Your reports need clean electricity data to show that shift honestly.
- Finding the laggards. With the field spread described earlier, a portfolio average can look fine while a handful of sites burn money.
Where we fit: the electricity side of the equation
We should be plain about scope. Enerlytics AI is an energy management platform for UK businesses. We do not sell heat meters or flow sensors, and SPF needs a heat measurement from somewhere. What we do cover is the electricity half of the calculation and everything around it:
- half-hourly consumption analytics, so you can see cycling, backup heater spikes and overnight draw at each site;
- bill validation and anomaly detection, so a faulty meter, a wrong tariff or an unexpected jump gets flagged against what you should be paying;
- multi-site management, so every location sits in one view and the weakest performers stand out;
- emissions reporting across Scopes 1, 2 and 3, so the gas-to-electricity shift shows up in your carbon figures.
You can start on the free forever Starter plan at £0 and manage multiple sites without upfront charges. Paid plans are Eco at £49 per month, Growth at £79 per month, Professional at £149 per month and Scale at £299 per month, for when your site count or reporting needs grow.
For related reading on our blog, see boiler efficiency tracking with half-hourly data, which is the useful before-and-after comparison if you are replacing gas plant, and our heat decarbonisation planning guide. If you run many locations, the multisite energy management roadmap explains how to structure the data.

Our perspective
We see the same pattern in energy data from every sector. Organisations spend heavily on the equipment and very little on checking that it behaves as designed. Heat pumps make that gap expensive, because the efficiency range is so wide: the field data above shows units of the same type landing anywhere from poor to excellent.
Our view is that monitoring should start cheap and get more precise only where the money justifies it. Begin with metered half-hourly electricity on every site. It costs little, and it already reveals the worst problems: backup heaters running in mild weather, short-cycling, overnight draw and bills that do not match consumption. Then add heat metering where it matters most: the largest sites, the ones with funding evidence to produce, and the ones your electricity data already flags as odd.
We would also resist the temptation to chase a single headline SPF. A figure with an unstated boundary is nearly useless. Decide what is included, write it down, and apply it everywhere. Then the trend at each site tells you more than any league table.
Finally, treat the first winter as a tuning period. Lower the heating curve in steps, watch the data, and keep what works. That is cheaper than any hardware upgrade and it is the change most likely to pay back.
— Chris
A practical monitoring plan for your first 90 days
Weeks 1 to 2: decide the boundary. Write down what counts as heat pump electricity: compressor only, or including pumps, fans and backup heating. Pick one and keep it.
Weeks 2 to 4: get electricity data flowing. Put every site's half-hourly consumption into one place. Check the bills against it. Mismatches are common and often recoverable.
Weeks 4 to 8: add heat measurement where it counts. Rank sites by consumption. Fit class-2 heat meters and MID-approved electricity meters on the biggest, and use lower-cost logging elsewhere, accepting wider error bars.
Weeks 8 to 12: tune and compare. Step the heating curves down, track the results, and flag any site whose SPF falls below your threshold. The Guru study's 2.5 line is a reasonable first red flag.
Then: repeat each season and report. Twelve months of data is what funders and assurance schemes ask for, so start the clock early.

FAQ
How do I monitor heat pump performance?
Measure the electricity going in and the heat coming out over the same period, then divide heat by electricity to get SPF. You need an electricity meter, a heat meter (or flow, return and flow rate sensors) and a defined system boundary. Higher-accuracy work uses MID-approved electricity meters and class-2 heat meters.
What is a good coefficient of performance for a heat pump?
For a seasonal figure, 3.5 is a solid target, and it is the level the Heat Pump Ready Programme uses for innovative software projects. In UK field data, only about 8% of air-source units reached an SPF of 3.5, so reaching it is a real achievement. A spot COP reading on a mild day is not comparable.
What is the difference between SPF and SCoP?
SPF is measured in a real installation over a year. SCoP is a theoretical efficiency under standard conditions. Only around 16% of ground-source and 6% of air-source units in the Ofgem-based analysis met or beat their design SCoP, which is why measured SPF is the figure to trust.
Can I monitor a heat pump without a heat meter?
You can watch electricity use, cycling and backup heater activity from half-hourly data alone, and that already exposes many faults. You cannot calculate true SPF without a heat measurement. If the evidence matters for funding or a warranty claim, fit proper meters.
Sources
- Domestic Heat Pumps: A Best Practice Guide, Energy Saving Trust
- In-Situ Heat Pump Performance
- Project case study: Guru Smart Heat Pumps, GOV.UK
- HPRP Round 2 clarification questions, GOV.UK
- OpenEnergyMonitor heat pump monitoring documentation
- emonTx4 heat pump monitor guide
- The most efficient way to run a heat pump, Energy Saving Trust
- Supporting households with low-carbon technology combinations, Energy Saving Trust
- How to make renewable technology more affordable, Energy Saving Trust
- Draft HNTAS existing heat network technical specification, Milestone 2