
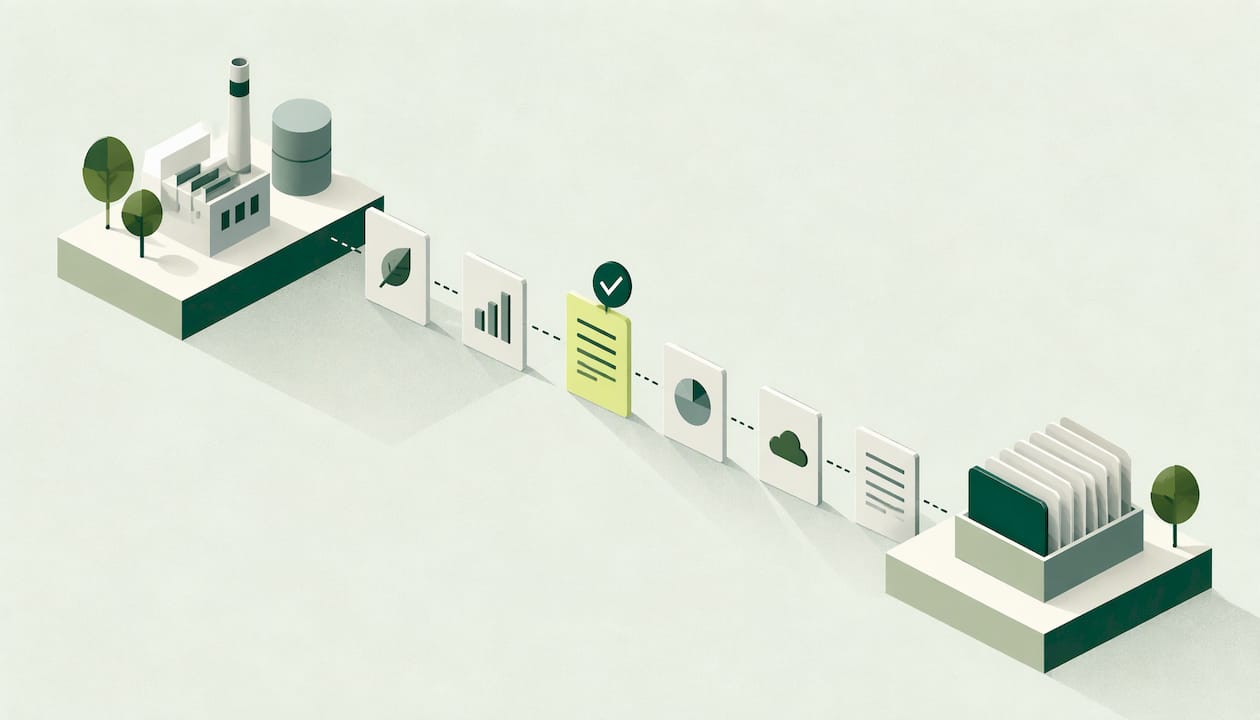
A carbon footprint audit trail is a documented chain of evidence that lets a reviewer, verifier or regulator trace any reported emissions figure back to its original source data. Glocert describes it as non-negotiable for verification. In practice it means every number in your report points to a bill, a meter read, a fuel record or a supplier file, plus the factor and calculation that turned it into tonnes of CO2e.
This guide shows what to keep for Scope 1, 2 and 3, how to link records to reported figures, which UK rules shape the evidence, and how to keep the trail intact year after year.
TL;DR
- An audit trail runs in both directions: from the reported figure down to the source record, and from the source record up to the figure.
- For each figure, keep the source document, the calculation (activity data × emission factor × GWP), the factor version and year, and who reviewed it.
- Use measured data (meter reads, bills, fuel litres) wherever you can, and document every estimate and the reason for it.
- Build the trail as you go. Rebuilding it before a verifier arrives is slow and leaves gaps.
- Keep one file or record set per reporting period and never overwrite prior-year data.
Table of Contents
- What a carbon audit trail actually is
- Why it matters even if nobody is auditing you yet
- What to keep, scope by scope
- The calculation layer: show your working
- A worked example: one site, one figure
- Multiple sites, fleets and manufacturing
- UK rules that shape the evidence
- What a verifier will do with your trail
- Common gaps and how to avoid them
- Perspective: why the trail should start at the bill
- Start your trail with free access
- FAQ
- Sources
What a carbon audit trail actually is
Think of it as a chain with named links. Glocert's data lineage guidance traces each data point through source generation and documentation, data capture, processing (conversions and emission-factor application), aggregation, quality review, and finally the reported figure. Assurance providers follow that same path to check the figure was derived accurately.

The standard that verifiers work to makes the idea concrete. ISO 14064-3:2019 defines two tests. Retracing follows data trails back to primary data to uncover errors in the GHG information. Tracing starts at primary data and follows it forward to the reported information. If your records support both directions, you have a working audit trail.
Sweco UK, a verification and reporting services provider, says a transparent, well-documented system of this kind is the basis of a successful verification and a credible inventory. Its verification process begins with an evidence gathering plan that shows the client's audit trail, so the verifier can examine data and evidence before a site audit.
Why it matters even if nobody is auditing you yet
Verification is not mandatory for most UK companies. The Carbon Trust recommends it as good practice for annual company reporting, but notes it is not required in the UK for GHG data disclosed in annual company reports. So why build the trail now?
- Customers and lenders ask. Supplier questionnaires and tenders increasingly want figures you can defend.
- Standards expect it. UK SRS S2 asks companies to disclose the measurement approach, inputs and assumptions used, with the reason for the choice and any changes made during the period. Paragraph 29(a) also requires measurement in line with the 2004 Greenhouse Gas Protocol Corporate Standard.
- It saves time every year. A documented method means the next reporting cycle starts from last year's workings, not a blank spreadsheet.
- It catches errors early. A bill that was overcharged or a meter that stopped reporting shows up as a gap in the trail before it becomes a wrong number in a report.
The UK SRS guide puts the standard simply: whether or not you buy assurance, the inventory should hold up to it.
What to keep, scope by scope
The principle is the same everywhere: primary data first. The Carbon Trust describes an evidence hierarchy. Collect primary data such as kWh from meter readings or bills, or litres of fuel, wherever practically possible. If that is not possible, use estimates based on proxy data. Where no direct data exists, use estimates based on similarities or benchmarks. Your audit trail should show which level each figure sits at.
Scope 1: fuel, vehicles and refrigerants
Glocert's evidence guidance gives practical examples for Scope 1:
- Stationary combustion: fuel purchase invoices or delivery records, meter readings, and boiler or furnace specifications.
- Mobile combustion: fuel card records and receipts, mileage logs and a vehicle fleet register.
- Fugitive emissions: refrigerant inventories and service or maintenance records for top-ups and disposals.
For transport, the Carbon Trust advises collecting fuel consumption by fuel type where possible. Fleet operators should therefore keep the fleet register current, because a vehicle missing from the register is a vehicle missing from the footprint.
Scope 2: purchased electricity, heat and steam
For gas and electricity, the Carbon Trust says to collect data in kWh from meter readings or bills. Keep the bill, the meter point reference, the period covered and whether reads were actual or estimated. If you report market-based Scope 2, keep the contractual instruments too. One UK manufacturer's basis for reporting guide shows the pattern: market-based emissions are determined by contractual instruments such as REGOs and PPAs.
This is where bill accuracy matters most. If a bill carries an estimated read or a billing error, the error flows straight into your Scope 2 figure. Our guide to checking business energy bills for errors shows what to look for, and our piece on missing meter reads covers how to spot gaps before bills are estimated.
Scope 3: supplier data, spend and estimates
Scope 3 is where trails most often go thin, because the data comes from other organizations. ESG Consulting's UK guide for 2026 lists what to retain for each material Scope 3 category:
- source records such as procurement extracts, invoices, supplier submissions, travel data, logistics records and waste reports;
- calculation logic: formulas, units, conversion steps, allocation methods and aggregation rules;
- factor evidence: the factor file, version, source year, unit basis and GWP reference;
- estimate controls: assumptions, proxy selection, completeness checks and limitations;
- governance records: reviewer comments, approval history, changes and final sign-off;
- a recalculation policy.
The UK SRS guide adds that the Scope 3 screen should cover all fifteen categories, with a reason recorded for each exclusion. Our Scope 3 playbook for energy teams walks through the categories, and if you lease buildings or equipment, classify leased asset emissions first so they do not fall between categories.
The calculation layer: show your working
Raw records are only half the trail. A reviewer also needs to reproduce your arithmetic. The Carbon Trust explains that footprints are measured in tonnes of CO2 equivalent and calculated as activity data multiplied by standard emission factors, and that governments usually update those factors yearly.
For UK reporting, the Department for Energy Security and Net Zero publishes the greenhouse gas conversion factors used by UK and international organizations. The 2024 set, for example, was published on 8 July 2024 and updated on 30 October 2024, in condensed, full and flat file formats. A newer annual edition follows each year, so always record which edition and year you used.
For every calculation, write down:
- The activity data and its unit (kWh, litres, km, £ of spend).
- The emission factor, its source, its version and its year.
- The GWP values and where they come from.
- The result in tCO2e.
- Any estimate or extrapolation, with the method and the reason. Glocert says estimation methods should be documented when actual data is unavailable.
Also record organizational and operational boundaries, exclusions, uncertainty, internal review and sign-off, and methodology changes, as Glocert's checklist recommends.
A worked example: one site, one figure
Suppose your report says a depot used a given amount of electricity last year. A traceable entry would look like this:
| Link in the chain | What you hold |
|---|---|
| Reported figure | Electricity line in the annual carbon report |
| Group total | Sum of site totals, checked to add up |
| Site total | The depot's 12 monthly figures in the workbook |
| Calculation | kWh × the named factor for that year, in a cell formula |
| Source data | 12 supplier bills with meter point reference and read type |
| Quality check | Reviewer initials, date and a note on any estimated reads |
Glocert recommends a traceability matrix that maps each reported figure to its supporting evidence at every lineage stage. Its checklist includes confirming the source document is retained, locating the value in the data collection system, documenting conversions so they are reproducible, verifying that site and group totals sum correctly, matching the reported figure to the calculation workbook, and documenting justified adjustments. The table above is a small version of that matrix.
Multiple sites, fleets and manufacturing
The trail gets harder as the number of sites grows, because each site has its own meters, suppliers and habits. The Digital Catapult's report on carbon accounting data management in UK manufacturing says that detailed audit trails documenting validation and verification activities are good practice for traceability and trust in data quality, and that emission factors and methodologies should be verified against recognized standards.
A few habits make multi-site work manageable:
- One naming convention for every site. Glocert's guidance includes consistent naming conventions and a data log recording when data was received, from whom and what processing was done.
- One owner per data stream. Someone is named for each site's electricity, gas, fuel and refrigerant records.
- Half-hourly data where you have it. Interval data lets you test whether a monthly bill matches what the meter recorded. See our notes on half-hourly meter checks and, for heating plant, boiler efficiency tracking.
- Instrument records. If your own sub-meters or loggers feed the numbers, keep their calibration records. Regular annual data logger calibration checks are the kind of validation activity an auditor can verify.
Our meter to report checklist sets out the same governance steps from the energy side.
UK rules that shape the evidence
Three layers matter for most UK businesses.
SECR. The 2018 Regulations require large unquoted companies and large LLPs to disclose emissions, energy consumption, energy-efficiency action (if any) and an intensity metric for financial years starting on or after 1 April 2019, where the information is practical to obtain. ICAEW summarizes the content: annual UK emissions in tCO2e, emissions from purchased electricity, an aggregate energy figure in kWh, the methodologies used, at least one intensity ratio, and a description of principal energy efficiency measures, with prior-year comparatives. The methodologies disclosure is the part your audit trail supports directly.
UK SRS S2. As noted above, it ties measurement to the GHG Protocol and asks for the approach, inputs and assumptions. The UK SRS guide turns this into a practical list: source records for every activity figure, named factors with their year, a written boundary and approach, the Scope 3 screen, and a log of changes with reasons.
Assurance standards. The same guide notes that the FRC issued ISSA (UK) 5000 on 12 November 2025 for voluntary use, effective for periods beginning on or after 15 December 2026. If you expect to buy assurance later, build the trail to that standard now. For broader context see our carbon reporting basics and CSRD carbon reporting guides.
What a verifier will do with your trail
Knowing the process helps you prepare. Carbon Verification Limited describes seven stages that follow ISO 14064-3 and ISO/IEC 17029: a verification agreement setting scope, standard, level of assurance and materiality; planning with risk assessment; the verification itself, testing the inventory, methods, emission factors and activity data; independent review; the decision and statement; and post-issue monitoring. It also notes that Scope 3 is methodologically demanding.
BS EN ISO 14064-3:2019 sets out two levels of assurance, reasonable and limited. LRQA's description of verification adds that verifiers review quantification methodologies and calculations, including the justification for factors and assumptions, and check the completeness of GHG sources and the controls around them.
You can borrow the logic internally. The IPCC's guidance separates quality control, routine technical checks during compilation that are documented and archived, from quality assurance, a planned review by people not directly involved in compiling, preferably independent third parties. In a small team, have someone who did not build the workbook review it and sign off.
Common gaps and how to avoid them
The same weaknesses appear again and again. Glocert's best-practice list and the Digital Catapult report point to the fixes.
| Gap | Fix |
|---|---|
| Hardcoded numbers in spreadsheets | Use cell references and link to source data files, as Glocert advises |
| Prior-year data overwritten | Keep separate files per reporting period |
| Utility bills never compared with meters | Cross-check data from different sources, for example bills against internal meters |
| Undocumented estimates | Record the method, proxy and reason beside each estimate |
| Factor year not recorded | Store the factor file, version and year with each calculation |
| No review trail | Log reviewer comments, approvals and changes |
| Records scattered in inboxes | Use a data log and software that supports export and audit trail reporting |
The Digital Catapult also recommends periodic internal audits to find improvement areas and keep data quality up over time. A short quarterly check, picking three reported figures and tracing each to source, is enough to start.
Perspective: why the trail should start at the bill
We see the same pattern in UK businesses. Carbon reports are built at year end from a pile of spreadsheets, and the weak point is almost never the arithmetic. It is the first link: a bill with an estimated read, a missing half-hour block, a site nobody owns.
That is why we built EnerlyticsAI around the bill and the meter first. Automated bill validation and anomaly detection are designed to flag problems while the invoice is still fresh, and half-hourly consumption analytics give you interval data to test monthly totals against. Carbon reporting across Scope 1, 2 and 3 then sits on data you have already checked.
Our view is simple: an audit trail should be a by-product of managing energy well, not a project you start when a verifier emails. Multi-site businesses feel this most, which is why we let you manage multiple sites without upfront charges.
Chris
Start your trail with free access
If your records live in scattered files, begin with the data that feeds the most figures: your bills and half-hourly reads. EnerlyticsAI's Starter plan is free forever and lets you bring your sites together in one place, with bill validation, half-hourly data and multi-site management in a user-friendly web interface. Paid plans start at £49 per month (Eco), with Growth at £79, Professional at £149 and Scale at £299 per month, for when you need more.
Create your free account and start with one site.
FAQ
Is a carbon audit trail a legal requirement in the UK?
No single rule uses that phrase. But SECR requires large unquoted companies and large LLPs to disclose the methodologies used to calculate their emissions and energy, and UK SRS S2 asks for the approach, inputs and assumptions. You can only disclose those honestly if your records show how each figure was made.
What is the difference between an audit trail and data lineage?
They describe the same idea from two angles. Data lineage is the path a data point takes from source to reported figure. The audit trail is the set of documents and logs that proves each step on that path happened as described.
Do I need third-party verification?
Not for UK annual company report disclosures, according to the Carbon Trust, though it recommends it as good practice. Many businesses build the trail first and decide on assurance later, for example when a customer or lender asks.
What should I do when actual data is missing?
Use the evidence hierarchy: primary data where possible, then proxy-based estimates, then benchmark-based estimates. Document the method, the assumption and the reason, and replace the estimate with actual data when it becomes available.
Sources
- Glocert: GHG Verification Readiness Checklist & Evidence Pack
- Glocert: ESG KPI Evidence Pack: Definitions, Controls & Data Lineage
- ISO 14064-3:2019 preview
- Sweco UK: GHG Emissions Verification & Reporting
- Carbon Trust: Practical steps for reporting on greenhouse gas emissions
- Carbon Trust: A guide to carbon footprinting for businesses
- UK SRS S2: Climate-related Disclosures
- Carbon Accounting for UK SRS S2
- Marshalls: Basis for Reporting Guide
- ESG Consulting: Scope 3 Emissions Reporting
- GOV.UK: Greenhouse gas reporting conversion factors 2024
- Digital Catapult: Carbon Accounting Data Management in UK Manufacturing
- PCS Precision: Testo data logger calibration
- The Companies (Directors' Report) and Limited Liability Partnerships (Energy and Carbon Report) Regulations 2018
- ICAEW: Carbon and energy reporting
- Carbon Verification: Verification and assurance FAQs
- LRQA: Emissions Verification Process
- IPCC: Quality Assurance/Quality Control and Verification