
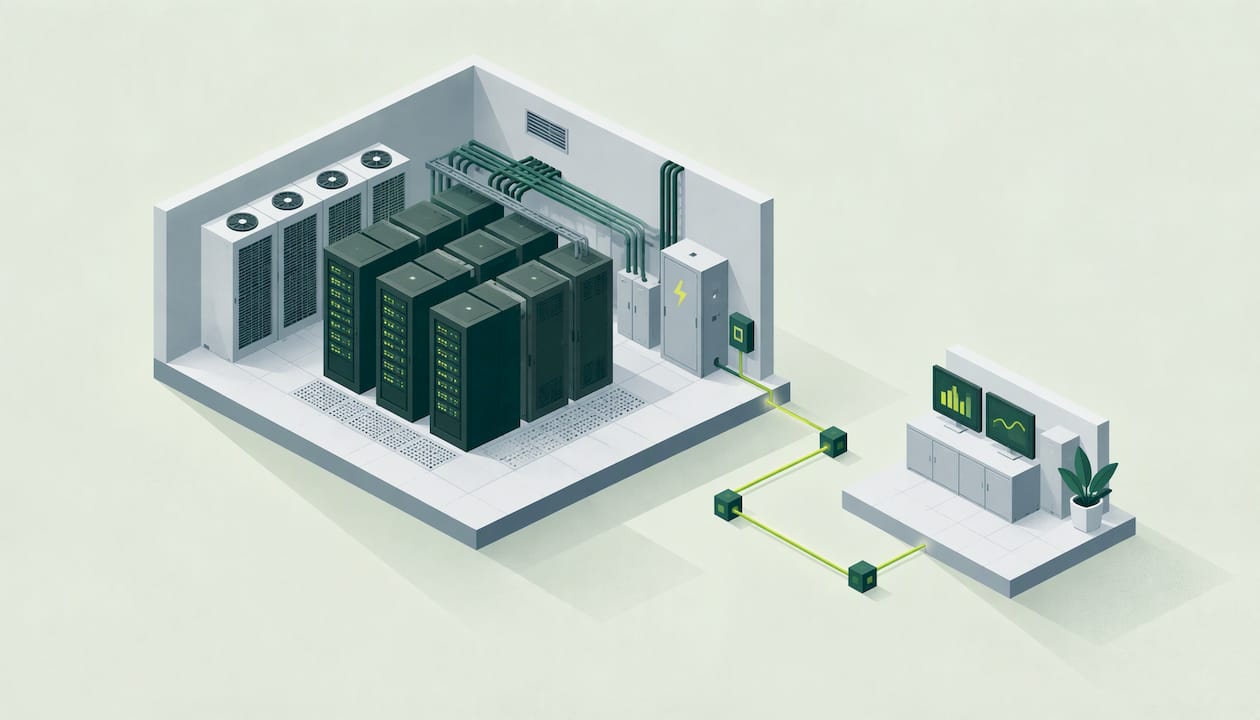
A server room uses electricity around the clock, and most of that load is invisible on a normal bill. The way to control it is to meter it separately, track it in half-hourly intervals, check each invoice against what the room actually drew, and report the emissions under the right scope. We built EnerlyticsAI for UK businesses that need exactly this: half-hourly consumption analytics, automated bill validation, anomaly detection and Scope 1, 2 and 3 carbon reporting, with a free forever plan to start on.
This guide is for facility managers, finance leads, sustainability managers and consultants who run or answer for an on-site server room, comms room or small enterprise data centre. It covers what drives the consumption, how to measure it, what usually reduces it and how to report it.
TL;DR
- Servers use most of the power directly, and around one-third of data-centre energy goes on cooling, so both the IT load and the overhead need measuring.
- Track power usage effectiveness (PUE), the ratio of total facility power to IT power, over a full year and with a fixed boundary, or the number tells you nothing.
- Purchased grid electricity at a site you control is Scope 2, while transmission losses and upstream fuel emissions are Scope 3.
- Lightly used servers are the biggest hidden waste: consolidating workloads often saves more than any cooling tweak.
- Half-hourly data, bill validation and multi-site comparison in one place turn a server room from a fixed overhead into a managed cost.
Table of Contents
- What counts as a server room
- Where the electricity goes
- How to measure server room energy
- A worked example
- Practical ways to reduce server room energy
- Reporting server room emissions: Scope 2 and Scope 3
- Comparing server rooms across sites
- Start with a free baseline
- FAQ
- Sources
What counts as a server room
The IEA EBC international review defines a server room as a small enterprise data centre, usually under 50 m² and holding roughly 25 racks or fewer, with dedicated or shared building power and cooling. That describes the cupboard behind reception, the converted storeroom at a factory or the machine room at a recycling depot.
This matters for the data you can find. The official UK statistics cover the large commercial facilities. DESNZ's 2026 report estimates that externally serving data centres in Great Britain used 4.5 TWh in 2024, about 2% of the 249.2 TWh of grid electricity, and that figure excludes enterprise data centres that organisations run for themselves. Your server room sits in the part nobody publishes a total for, so your own metering is the only reliable source.
The national picture still sets the context. The same report puts the rise in GB data-centre electricity use between 2020 and 2024 at 1.3 TWh, or 41%. A House of Commons Library briefing notes that NESO expected UK data-centre demand to climb from 5 TWh to 22 TWh by 2030, while cautioning that such projections are uncertain. Demand for power is rising, and grid capacity, connection costs and carbon expectations rise with it.
Where the electricity goes
A server room's load has four parts, and each needs a different fix.
| Component | Typical share of data-centre electricity | What drives it |
|---|---|---|
| Servers and computing | Roughly 40% | Number of machines, utilisation, age |
| Cooling | About 38% to 40% | Set points, airflow, room layout, outside climate |
| Networking and storage | About 10% | Switches, storage arrays, data volumes |
| Power conversion, UPS, lighting | The remainder | UPS efficiency, load level, standby losses |
The split comes from a US Congressional Research Service estimate for large facilities, so treat it as a guide to proportions, not as your room's numbers. The UK Parliament's POST briefing gives a similar picture: most energy powers the computing itself, with around a third used for cooling.
Small rooms often do worse on the cooling share. A comfort air-conditioning unit built for an office, running against a steady heat load all year, can be far less efficient than purpose-built room cooling. Only your own sub-metered data will show whether that applies to you.

The hidden driver: idle machines
The US Department of Energy's 2024 design guide reports enterprise server utilisation commonly sitting around 20% to 40%. It also says server efficiency can improve by about 50% when processor utilisation doubles from low levels of 20% to 30%. An older Lawrence Berkeley National Laboratory fact sheet found typical servers running at 5% to 15% utilisation while drawing 60% to 90% of peak power, and recommends consolidating or virtualising workloads. Both are US sources and the LBNL one dates from 2012, so they show the principle and not a guaranteed UK saving. The principle is simple: a lightly used server costs nearly as much to run as a busy one.
The POST briefing adds a related point: accumulated low-value or unused data can drive extra storage and computing infrastructure, with the energy, cost and environmental impact that follows. Old backups, orphaned virtual machines and forgotten test servers are all load you pay for.
How to measure server room energy
You cannot manage a load you cannot see. The measurement routine has four steps.
1. Meter the room separately
The European Code of Conduct for data centres, as reviewed by the EU Joint Research Centre, says facility electricity should at minimum be metered at the utility intake for a stand-alone facility or at a data-centre submeter. Optional extra meters can track chillers, room air conditioners and UPS input and output.
In most UK buildings the server room shares a supply with offices or production, so a submeter on the room's distribution board is the practical starting point. Fitting one is work for a qualified electrician, for example through a service where you can hire electricians in London on a project basis if your site is in the capital. Add a second meter on the UPS output so you can separate IT load from overhead.
2. Capture half-hourly data
Monthly totals hide the pattern. A server room should be close to flat around the clock, so any step change, evening spike or weekend rise points to a fault, a new device or a cooling problem. Half-hourly data is the interval the UK electricity market settles on, which also lets you line your readings up with what the supplier bills. Our half-hourly data view is built for this kind of consumption analysis.
3. Calculate PUE correctly
PUE is total facility input power divided by IT load power. A value nearer 1 means less energy spent on cooling, power conversion, lighting, fans and pumps. The JRC review uses this definition.
Three rules keep the number honest:
- Measure energy (kWh), not apparent power (kVA), because kVA ignores power factor.
- Measure total facility and IT energy over the same period, ideally a full 12 months, so summer cooling and winter conditions both count.
- Keep the boundary fixed. If you change what the "total" includes, last year's PUE and this year's are no longer comparable.
These are the principles of the ISO/IEC 30134-2 measurement standard. Voluntary targets exist too: signatories of the Climate Neutral Data Centre Pact committed to PUE of 1.3 in cool climates and 1.4 in warm ones for new facilities, with existing ones aiming for those targets by January 2030, according to the House of Commons Library briefing. That pact is voluntary and aimed at large operators, not a legal standard for your room, but it shows where the industry is heading.
4. Check the bill against the meter
Once the room has its own readings, you have an independent baseline to test invoices against. A bill that does not reconcile with half-hourly consumption, or a sudden jump in a month when the IT estate did not change, deserves a query. Automated bill validation in the platform does this comparison for you, and our Bills page shows how it works. For spotting the oddities in the first place, see our guide to energy anomaly detection.
A worked example
Take a hypothetical server room with a steady IT load of 20 kW.
- IT energy: 20 kW × 8,760 hours = 175,200 kWh a year.
- With a PUE of 1.8, total facility energy is 315,360 kWh, so 140,160 kWh goes on cooling, power conversion and other overhead.
- Improve airflow, raise the set point within the supplier's guidance and replace an ageing UPS, bringing PUE to 1.5. Total energy falls to 262,800 kWh.
- The saving is 52,560 kWh a year, about 17% of the original total, with no change to the IT service.
Now consolidate five lightly used servers onto one virtualised host and the IT load itself drops, and the cooling and UPS losses drop with it. This is why the order matters: reduce the IT load first, then the overhead. The figures are an illustration of the arithmetic, not a forecast for your site.
Practical ways to reduce server room energy
- Consolidate and virtualise. Retire idle machines and move small workloads onto fewer, better-used hosts. Per the DOE and LBNL evidence above, utilisation is where the largest waste sits.
- Clear out unused data and systems. Storage and spare capacity that nobody uses still draws power, as the POST briefing notes.
- Plan hardware refresh deliberately. POST puts the lifespan of servers, network equipment and batteries at about three to eight years and points to refurbishment, remanufacturing and recycling as ways to handle e-waste. Newer machines usually do more work per watt, so replacement timing is an energy decision as well as a capital one.
- Fix airflow and set points. Separate hot and cold air, seal gaps and avoid overcooling. Running too hot raises hotspots and fire risk, so keep within the equipment manufacturer's guidance.
- Right-size the UPS. A UPS that is far larger than the load runs inefficiently. Metering its input and output shows the loss directly.
- Watch for peaks. Cooling and backup tests can push demand up at the wrong time. Our peak demand analysis guide explains how to find and flatten them.
For wider ideas across the whole building, see energy savings opportunities for UK businesses.
Reporting server room emissions: Scope 2 and Scope 3
Electricity is where server room emissions sit, and the scope depends on what you are counting.
- Scope 2: purchased grid electricity at a site you control. The 2025 UK Government conversion-factor methodology classes it this way.
- Scope 3: transmission and distribution losses, and the upstream extraction, refining and transport of fuels, which that methodology reports separately. Embodied emissions from buying servers, and any hosting you buy from a third party, also sit in Scope 3.
- Scope 1: relevant if the room has a diesel backup generator or uses refrigerant gases in its cooling, since those are direct emissions.
The same methodology explains that UK electricity factors represent average grid emissions and change year to year with the generation mix and net imports. That is why you should apply the factor for the reporting year, not reuse an old one. For scale, the Electric Insights report puts Britain's average grid carbon intensity in 2025 at 121 g/kWh. That is a generation statistic and not the factor to use in your report, but it shows how much the same kilowatt-hour can vary between years.
If you claim renewable electricity, note that proposed changes to the GHG Protocol's Scope 2 guidance are, according to BusinessGreen, intended to apply from 2027, with closer time and grid-region matching and stricter certificate criteria. These are proposals, so check the final text before restating a market-based figure. Many reporters show both a market-based and a location-based Scope 2 figure, and keeping both in your records makes any future switch easier.
Consultants preparing client reports can pull the server room's consumption into a wider carbon picture. Our Reports page covers Scope 1, 2 and 3 carbon reporting.
Comparing server rooms across sites

Organisations with several sites usually have several server rooms, each built at a different time, with different cooling and different suppliers. Comparison only works if the boundaries match. Use the same PUE definition, the same measurement period and the same meter points at every site, or you will chase differences that exist only on paper.
The European Code of Conduct describes an improvement cycle that suits this: measure first, audit, agree an action plan, monitor regularly and implement the expected practices. Treat it as a loop. Re-measure after each change so you know what the change delivered. Useful indicators to compare include annual kWh, PUE, kWh per rack and overnight baseline load. Our guide to energy management KPIs lists ten worth tracking, and the energy monitoring strategy guide shows how to set up the routine. A single view across locations is what multi-site management is for.
What we think
A server room is one of the few loads that never switches off, which makes it the easiest to forget and the easiest to improve. Most businesses see it only as part of one monthly total, and that is why waste and billing errors persist unnoticed.
We believe the answer is not another spreadsheet. It is half-hourly data you can see, invoices checked automatically against consumption, anomalies flagged when a load changes shape, and Scope 1, 2 and 3 reporting from the same data. That is the platform we have built, and you can use it across multiple sites from a free forever plan, with no charge to start.
Get the baseline first. Every saving after that can be proved.
Chris
Start with a free baseline
EnerlyticsAI gives UK businesses half-hourly consumption analytics, automated bill validation, anomaly detection and Scope 1, 2 and 3 carbon reporting in a user-friendly web interface. The Starter plan is free forever and lets you manage multiple sites without upfront charges. Create a free account to put your server room beside the rest of your estate.
If your needs grow, paid plans start with Eco at £49 per month, then Growth at £79 per month, Professional at £149 per month and Scale at £299 per month. You can find out more on the EnerlyticsAI site.
FAQ
How much electricity does a server room use?
It depends on the IT load, the PUE and the hours of operation, and a steady 20 kW IT load at PUE 1.8 works out at about 315,000 kWh a year. National statistics cover large commercial data centres, not in-house rooms, so your own submeter is the reliable source.
What is a good PUE for a server room?
The closer to 1, the less energy goes on overhead. The voluntary Climate Neutral Data Centre Pact targets 1.3 to 1.4 for large facilities. Smaller rooms often start higher, so the best benchmark is your own PUE measured over 12 months and improved step by step.
Is server room electricity Scope 1, 2 or 3?
Purchased grid electricity at a site you control is Scope 2. Transmission losses and upstream fuel emissions are Scope 3, as is hosting bought from a third party. Backup diesel generators and cooling refrigerants are Scope 1.
What is the quickest way to cut server room energy use?
Start with the IT load. Switch off or consolidate idle and lightly used servers, because they draw much of their peak power even when barely working. Then improve airflow and cooling set points, and re-measure to confirm the saving.
Sources
- Data centre electricity consumption in Great Britain, 2020 to 2024 (DESNZ)
- Data centres: planning policy, sustainability, and consumption (House of Commons Library)
- What are data centres and how sustainable are they? (POST)
- International review of energy efficiency in data centres (IEA EBC)
- Data Centers and Their Energy Consumption: Frequently Asked Questions (CRS)
- Best Practices Guide for Energy-Efficient Data Center Design (US DOE)
- Fact Sheet: Improving Energy Efficiency for Server Rooms (LBNL)
- Trends in data centre energy consumption under the European Code of Conduct (JRC)
- 2025 Government greenhouse gas conversion factors: methodology paper
- Electric Insights Q4 2025
- How can companies best navigate the era of energy market volatility (BusinessGreen)